Histogram in WPF Charts (SfChart)
Histogram Chart
HistogramSeries is one of the seven basic tools of quality control to visualize the frequency distribution of data over a certain time period. HistogramSeries is often used to plot the density of data.
The following code example shows how to add the HistogramSeries:
<chart:HistogramSeries
    x:Name="histogramSeries"
    HistogramInterval="5"
    Interior="#BCBCBC"
    ItemsSource="{Binding Product}"
    XBindingPath="Price"
    YBindingPath="Value"/>
HistogramSeries series = new HistogramSeries()
{
ItemsSource = new ViewModel().Product,
XBindingPath = "Price",
YBindingPath = "Value",
HistogramInterval = 5,
Interior = new SolidColorBrush(Color.FromRgb(0xBC, 0xBC, 0xBC))
};
chart.Series.Add(series);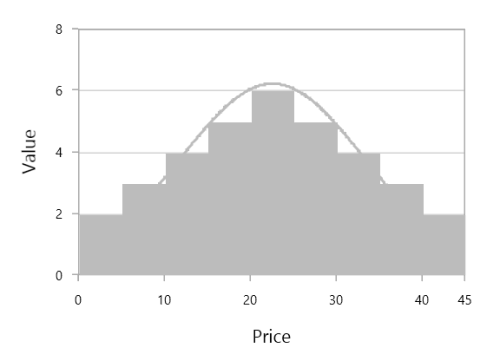
You can customize the interval using the HistogramInterval property, and the normal distribution curve can be collapsed using the ShowNormalDistributionCurve property.
<chart:HistogramSeries
    x:Name="histogramSeries"
    HistogramInterval="5"
    ShowNormalDistributionCurve="False"
    Interior="#BCBCBC"
    ItemsSource="{Binding Product}"
    XBindingPath="Price"
    YBindingPath="Value"/>
HistogramSeries series = new HistogramSeries()
{
ItemsSource = new ViewModel().Product,
XBindingPath = "Price",
YBindingPath = "Value",
HistogramInterval = 5,
ShowNormalDistributionCurve = false,
Interior = new SolidColorBrush(Color.FromRgb(0xBC, 0xBC, 0xBC))
};
chart.Series.Add(series);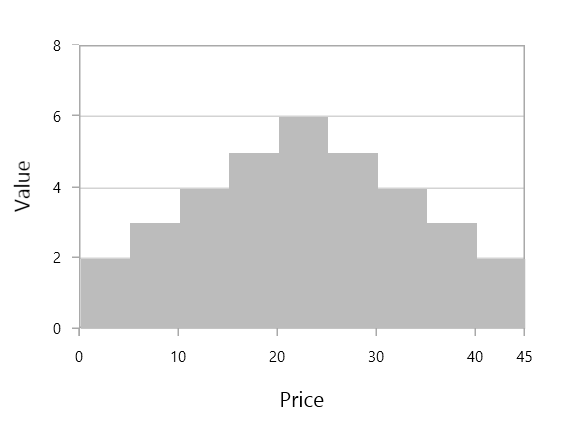
CurveLineStyle
You can customize the normal distribution curve by using the CurveLineStyle property.
<!-- code omitted for brevity -->
<Style TargetType="Polyline" x:Key="CurveColorStyle">
    <Setter Property="Stroke" Value="LightSeaGreen"/>
    <Setter Property="StrokeThickness" Value="3"/>
    <Setter Property="StrokeDashArray" Value="1,2" />
</Style>
<!-- code omitted for brevity -->

<chart:HistogramSeries
    x:Name="histogramSeries"
    HistogramInterval="5"
    ShowNormalDistributionCurve="True"
    CurveLineStyle="{StaticResource CurveColorStyle}"
    Interior="LightSkyBlue"
    ItemsSource="{Binding Product}"
    XBindingPath="Price"
    YBindingPath="Value"/>
// code omitted for brevity
HistogramSeries series = new HistogramSeries()
{
ItemsSource = new ViewModel().Product,
XBindingPath = "Price",
YBindingPath = "Value",
HistogramInterval = 5,
ShowNormalDistributionCurve = true,
CurveLineStyle = histogramChart.Resources["CurveColorStyle"] as Style,
Interior = new SolidColorBrush(Colors.LightSkyBlue)
};
chart.Series.Add(series);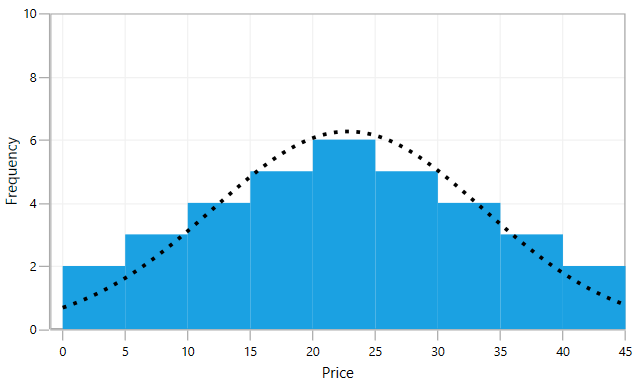
NOTE
You can explore our WPF Histogram Chart feature tour page for its groundbreaking features. You can also explore our WPF Histogram Chart example to know how to represent time-dependent data, showing trends in data at equal intervals.