Scale Breaks in WPF Charts
Scale break is a stripe drawn in the chart area to denote the break in the continuity of data points. Scale breaks are useful when there is a large difference in the data points. Scale break allows you to have different ranges on the same axis to visualize data effectively.
Positioning the Breaks
WPF Charts provides Start and End properties for defining the scale break range (ranges that need to be skipped). These values are based on axis values.
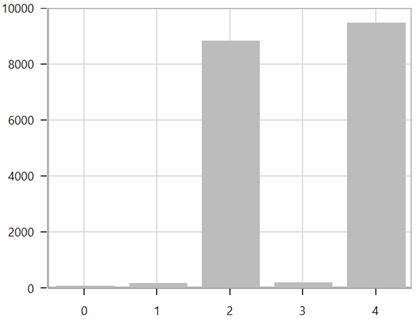
The following image has data points with both greater and smaller magnitude, but the segments with smaller values is not visualized properly.
Applying scale breaks helps in the proper visualization of all the data points.
<chart:SfChart.SecondaryAxis>
    <chart:NumericalAxis>
        <chart:NumericalAxis.AxisScaleBreaks>
            <chart:ChartAxisScaleBreak
                Start="300"
                End="8500">
            </chart:ChartAxisScaleBreak>
        </chart:NumericalAxis.AxisScaleBreaks>
    </chart:NumericalAxis>
</chart:SfChart.SecondaryAxis>
NumericalAxis axis = new NumericalAxis();
ChartAxisScaleBreak scaleBreak = new ChartAxisScaleBreak();
scaleBreak.Start = 300;
scaleBreak.End = 8500;
axis.AxisScaleBreaks.Add(scaleBreak);
chart.SecondaryAxis = axis;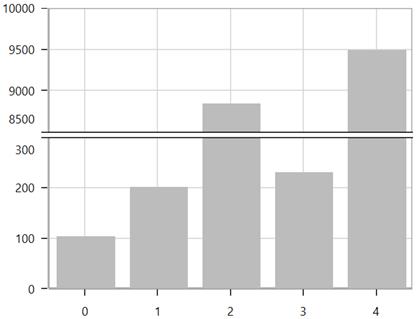
Break Position Customization
For the defined break range, its position in the chart area can be customized using the BreakPosition property in the numerical axis.
Break position is determined based on the following factors:
Data Count
Based on the number of data points that fall in axis ranges (other than the break range), the scale break will be positioned.
In the below image, the range [0,350] contains more data compared to the range
[8000, 10000], hence the break is positioned in such a way that it allocates more space to the range [0,350].
Range [0,350] takes nearly 4/5th of the axis height and the range [8000,10000] takes 1/5th.
<chart:SfChart.SecondaryAxis>
    <chart:NumericalAxis x:Name="axis" BreakPosition="DataCount">
        <chart:NumericalAxis.AxisScaleBreaks>
            <chart:ChartAxisScaleBreak  Start="350" End="8000"/>
        </chart:NumericalAxis.AxisScaleBreaks>
    </chart:NumericalAxis>
</chart:SfChart.SecondaryAxis>
NumericalAxis axis = new NumericalAxis();
axis.BreakPosition = ScaleBreakPosition.DataCount;
ChartAxisScaleBreak scaleBreak = new ChartAxisScaleBreak();
scaleBreak.Start = 350;
scaleBreak.End = 8000;
axis.AxisScaleBreaks.Add(scaleBreak);
chart.SecondaryAxis = axis;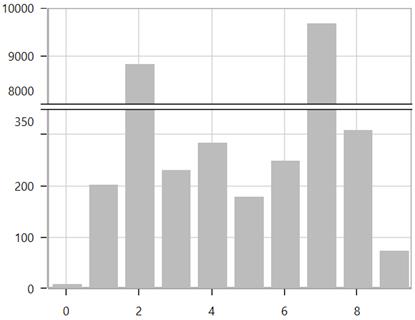
Scale
Scale option allows you to position the breaks based on the delta of each axis range relative to the other.
<chart:SfChart.SecondaryAxis>
    <chart:NumericalAxis x:Name="axis" BreakPosition="Scale">
        <chart:NumericalAxis.AxisScaleBreaks>
            <chart:ChartAxisScaleBreak  Start="350" End="8000"/>
        </chart:NumericalAxis.AxisScaleBreaks>
    </chart:NumericalAxis>
</chart:SfChart.SecondaryAxis>
NumericalAxis axis = new NumericalAxis();
axis.BreakPosition = ScaleBreakPosition.Scale;
ChartAxisScaleBreak scaleBreak = new ChartAxisScaleBreak();
scaleBreak.Start = 350;
scaleBreak.End = 8000;
axis.AxisScaleBreaks.Add(scaleBreak);
chart.SecondaryAxis = axis;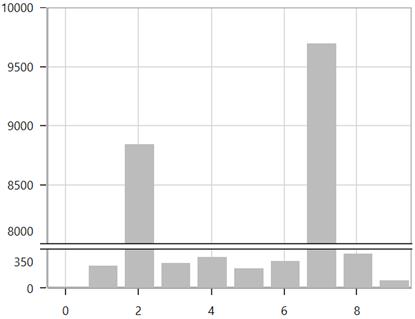
Percent
Percent option allows you to position the breaks at the specified percentage of the axis’s available height.
Percentage can be specified using the BreakPercent property. The default BreakPercent value is 50.
In the below image, each break is given a percent value of 50. The first break is positioned at 50% of the axis, and the next break is positioned at 50% of the remaining space, and so on.
<chart:SfChart.SecondaryAxis>
    <chart:NumericalAxis
        x:Name="axis"
        BreakPosition="Percent">
        <chart:NumericalAxis.AxisScaleBreaks>
            <chart:ChartAxisScaleBreak
                Start="300"
                End="8000"
                BreakPercent="50">
            </chart:ChartAxisScaleBreak>

            <chart:ChartAxisScaleBreak
                Start="12500"
                End="19000"
                BreakPercent="50">
            </chart:ChartAxisScaleBreak>
        </chart:NumericalAxis.AxisScaleBreaks>
    </chart:NumericalAxis>
</chart:SfChart.SecondaryAxis>
NumericalAxis axis = new NumericalAxis();
axis.BreakPosition = ScaleBreakPosition.Percent;
ChartAxisScaleBreak scaleBreak1 = new ChartAxisScaleBreak();
scaleBreak1.Start = 300;
scaleBreak1.End = 8000;
scaleBreak1.BreakPercent = 50;
axis.AxisScaleBreaks.Add(scaleBreak1);
ChartAxisScaleBreak scaleBreak2 = new ChartAxisScaleBreak();
scaleBreak2.Start = 12500;
scaleBreak2.End = 19000;
scaleBreak2.BreakPercent = 50;
axis.AxisScaleBreaks.Add(scaleBreak2);
chart.SecondaryAxis = axis;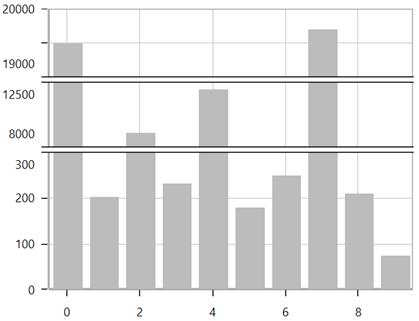
Multiple Breaks
Multiple breaks can be included in the chart.
<chart:SfChart.SecondaryAxis>
    <chart:NumericalAxis>
        <chart:NumericalAxis.AxisScaleBreaks>
            <chart:ChartAxisScaleBreak Start="300" End="8000"/>
            <chart:ChartAxisScaleBreak Start="12500" End="19000"/>
        </chart:NumericalAxis.AxisScaleBreaks>
    </chart:NumericalAxis>
</chart:SfChart.SecondaryAxis>
NumericalAxis axis = new NumericalAxis();
ChartAxisScaleBreak scaleBreak1 = new ChartAxisScaleBreak();
scaleBreak1.Start = 300;
scaleBreak1.End = 8000;
axis.AxisScaleBreaks.Add(scaleBreak1);
ChartAxisScaleBreak scaleBreak2 = new ChartAxisScaleBreak();
scaleBreak2.Start = 12500;
scaleBreak2.End = 19000;
axis.AxisScaleBreaks.Add(scaleBreak2);
chart.SecondaryAxis = axis;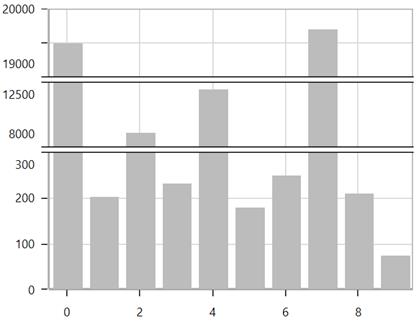
Customization
The following are the customizing options for scale break.
Line type such as Wave or StraightLine, background, spacing, stroke, stroke thickness of the scale break can be customized using LineType, Fill, BreakSpacing, Stroke, StrokeThickness properties respectively.
<chart:SfChart.SecondaryAxis>
    <chart:NumericalAxis>
        <chart:NumericalAxis.AxisScaleBreaks>
            <chart:ChartAxisScaleBreak
                Start="300"
                End="8500"
                BreakSpacing="12"
                LineType="Wave"
                Fill="PaleTurquoise"
                Stroke="Black"
                StrokeThickness="1.2">
            </chart:ChartAxisScaleBreak>
        </chart:NumericalAxis.AxisScaleBreaks>
    </chart:NumericalAxis>
</chart:SfChart.SecondaryAxis>
NumericalAxis axis = new NumericalAxis();
ChartAxisScaleBreak scaleBreak = new ChartAxisScaleBreak();
scaleBreak.Start = 300;
scaleBreak.End = 8500;
scaleBreak.LineType = BreakLineType.Wave;
scaleBreak.BreakSpacing = 12;
scaleBreak.Fill = new SolidColorBrush(Colors.PaleTurquoise);
scaleBreak.Stroke = new SolidColorBrush(Colors.Black);
scaleBreak.StrokeThickness = 1.2;
axis.AxisScaleBreaks.Add(scaleBreak);
chart.SecondaryAxis = axis;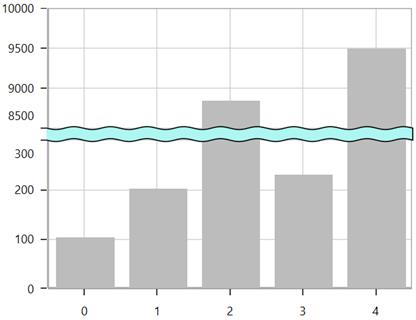
You can refer to our WPF Charts feature tour page for its groundbreaking feature representations. You can also explore our WPF Charts example to know various chart types and how they can be easily configured with built-in support for creating stunning visual effects.