Ranges in WPF Bullet Graph (SfBulletGraph)
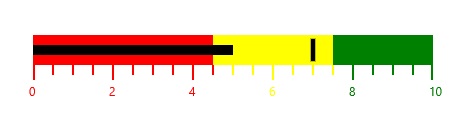
Ranges for a bullet graph are a collection of qualitative ranges. A qualitative range is a visual element that begins at RangeStart and ends at a specified RangeEnd, continuing from the previous range’s RangeEnd. The qualitative ranges are arranged according to each RangeEnd value.
Customizing Ranges
The width of the ranges can be customized by setting the QualitativeRangesSize property. By changing the RangeStroke of the qualitative range, the stroke of the range can be personalized. By setting the RangeOpacity of the qualitative range, the opacity of the range is modified.
<syncfusion:SfBulletGraph QualitativeRangesSize="30" Minimum="0" Maximum="10" Interval="2"
                                  MinorTicksPerInterval="3" MinorTickSize="8" FeaturedMeasure="5"
                                  ComparativeMeasure="7">
            <syncfusion:SfBulletGraph.QualitativeRanges>
                <syncfusion:QualitativeRange RangeEnd="4.5"
                                             RangeStroke="Red"
                                             RangeOpacity="1">
                </syncfusion:QualitativeRange>
                <syncfusion:QualitativeRange RangeEnd="7.5"
                                             RangeStroke="Yellow"
                                             RangeOpacity="1">
                </syncfusion:QualitativeRange>
                <syncfusion:QualitativeRange RangeEnd="10"
                                             RangeStroke="Green"
                                             RangeOpacity="1">
                </syncfusion:QualitativeRange>
            </syncfusion:SfBulletGraph.QualitativeRanges>
        </syncfusion:SfBulletGraph>
SfBulletGraph bulletgraph = new SfBulletGraph();
bulletgraph.Minimum = 0;
bulletgraph.Maximum = 10;
bulletgraph.FeaturedMeasure = 5;
bulletgraph.ComparativeMeasure = 7;
bulletgraph.Interval = 2;
bulletgraph.MinorTickSize = 8;
bulletgraph.MinorTicksPerInterval = 3;
bulletgraph.QualitativeRangesSize = 30;
bulletgraph.QualitativeRanges.Add(new QualitativeRange()
{
RangeEnd = 4.5,
RangeOpacity = 1,
RangeStroke = new SolidColorBrush(Colors.Red)
});
bulletgraph.QualitativeRanges.Add(new QualitativeRange()
{
RangeEnd = 7.5,
RangeOpacity = 1,
RangeStroke = new SolidColorBrush(Colors.Yellow)
});
bulletgraph.QualitativeRanges.Add(new QualitativeRange()
{
RangeEnd = 10,
RangeOpacity = 1,
RangeStroke = new SolidColorBrush(Colors.Green)
});
Grid.SetColumn(bulletgraph, 0);
grid.Children.Add(bulletgraph);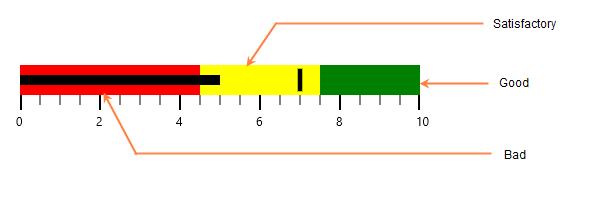
Binding RangeStroke to Ticks and Labels
By setting the BindRangeStrokeToLabels property, the stroke of the labels is set to match the stroke of the specified ranges. Similarly, by setting the BindRangeStrokeToTicks property, the stroke of the ticks is set to match the stroke of the specified ranges.
<syncfusion:SfBulletGraph QualitativeRangesSize="30" Minimum="0" Maximum="10" Interval="2"
    BindRangeStrokeToLabels="True" BindRangeStrokeToTicks="True"
                                  MinorTicksPerInterval="3" MinorTickSize="8" FeaturedMeasure="5"
                                  ComparativeMeasure="7">
            <syncfusion:SfBulletGraph.QualitativeRanges>
                <syncfusion:QualitativeRange RangeEnd="4.5"
                                             RangeStroke="Red"
                                             RangeOpacity="1">
                </syncfusion:QualitativeRange>
                <syncfusion:QualitativeRange RangeEnd="7.5"
                                             RangeStroke="Yellow"
                                             RangeOpacity="1">
                </syncfusion:QualitativeRange>
                <syncfusion:QualitativeRange RangeEnd="10"
                                             RangeStroke="Green"
                                             RangeOpacity="1">
                </syncfusion:QualitativeRange>
            </syncfusion:SfBulletGraph.QualitativeRanges>
        </syncfusion:SfBulletGraph>
SfBulletGraph bulletgraph = new SfBulletGraph();
bulletgraph.Minimum = 0;
bulletgraph.Maximum = 10;
bulletgraph.FeaturedMeasure = 5;
bulletgraph.ComparativeMeasure = 7;
bulletgraph.Interval = 2;
bulletgraph.MinorTickSize = 8;
bulletgraph.MinorTicksPerInterval = 3;
bulletgraph.QualitativeRangesSize = 30;
bulletgraph.BindRangeStrokeToLabels = true;
bulletgraph.BindRangeStrokeToTicks = true;
bulletgraph.QualitativeRanges.Add(new QualitativeRange()
{
RangeEnd = 4.5,
RangeOpacity = 1,
RangeStroke = new SolidColorBrush(Colors.Red)
});
bulletgraph.QualitativeRanges.Add(new QualitativeRange()
{
RangeEnd = 7.5,
RangeOpacity = 1,
RangeStroke = new SolidColorBrush(Colors.Yellow)
});
bulletgraph.QualitativeRanges.Add(new QualitativeRange()
{
RangeEnd = 10,
RangeOpacity = 1,
RangeStroke = new SolidColorBrush(Colors.Green)
});
Grid.SetColumn(bulletgraph, 0);
grid.Children.Add(bulletgraph);