Chart Area in WinUI Chart
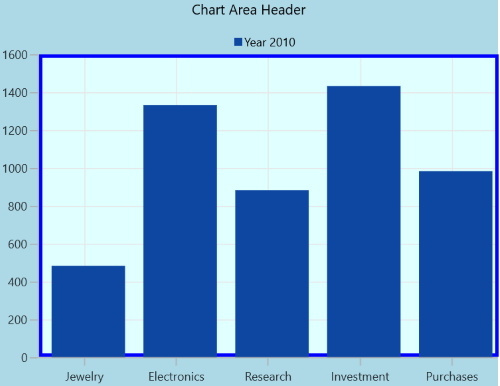
Chart area represents the entire chart and all its elements. It is a virtual rectangular area that includes all the chart elements such as the title, axes, legends, and series.
Customization
The chart provides properties such as PlotAreaBorderBrush, PlotAreaBorderThickness, and PlotAreaBackground for customizing the plot area.
<chart:SfCartesianChart
    Header="Chart Area Header"
    PlotAreaBackground="LightCyan"
    Background="LightBlue"
    PlotAreaBorderBrush="Blue"
    PlotAreaBorderThickness="3">

    <!-- Configure additional chart elements -->
    <chart:SfCartesianChart.XAxes>
        <chart:CategoryAxis/>
    </chart:SfCartesianChart.XAxes>

    <chart:SfCartesianChart.YAxes>
        <chart:NumericalAxis/>
    </chart:SfCartesianChart.YAxes>

    <chart:SfCartesianChart.Legend>
        <chart:ChartLegend/>
    </chart:SfCartesianChart.Legend>

    <chart:SfCartesianChart.Series>
        <chart:ColumnSeries
            ItemsSource="{Binding Data}"
            XBindingPath="Demand"
            YBindingPath="Year2010"
            Label="Year 2010">
        </chart:ColumnSeries>
    </chart:SfCartesianChart.Series>
</chart:SfCartesianChart>
SfCartesianChart chart = new SfCartesianChart();
chart.Header = "Chart Area Header";
chart.PlotAreaBackground = new SolidColorBrush(Colors.LightCyan);
chart.PlotAreaBorderBrush = new SolidColorBrush(Colors.Blue);
chart.Background = new SolidColorBrush(Colors.LightBlue);
chart.PlotAreaBorderThickness = new Thickness(3);
CategoryAxis primaryAxis = new CategoryAxis();
chart.XAxes.Add(primaryAxis);
NumericalAxis secondaryAxis = new NumericalAxis();
chart.YAxes.Add(secondaryAxis);
ChartLegend legend = new ChartLegend();
chart.Legend = legend;
ColumnSeries series = new ColumnSeries()
{
ItemsSource = new ViewModel().Data,
XBindingPath = "Demand",
YBindingPath = "Year2010",
Label = "Year 2010"
};
chart.Series.Add(series);
this.Content = chart;