Getting Started with the Vue Chart Component in the Quasar Framework
This section provides a step-by-step guide to creating a Quasar application and integrating the Syncfusion® Vue Chart component using the Composition API. It helps developers set up a responsive, high-performance charting solution within the Quasar ecosystem.
The Quasar Framework is a Vue.js–based open-source framework that enables developers to build modern, high-performance applications for web, mobile, and desktop from a single code base.
Prerequisites
Ensure that the development environment meets the requirements listed in System requirements for Syncfusion® Vue Chart components.
Set Up the Quasar Project
To create a new Quasar project, run the following command:
npm init quasarThe command prompts for project options; example prompts appear below:
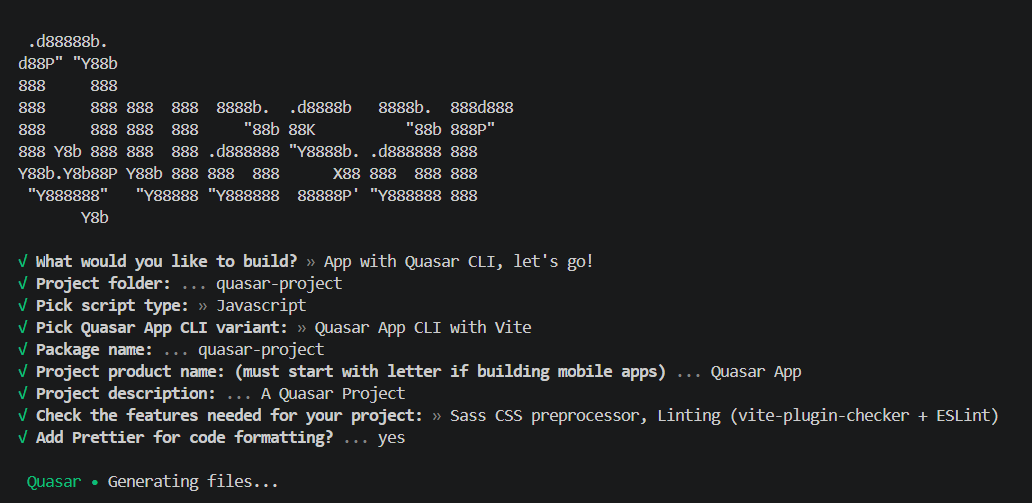
The generator installs dependencies when prompted. Confirm installation to proceed, as shown below:

Navigate to the project directory:
cd quasar-projectNow that quasar-project is ready, add the Syncfusion® Vue Chart component to the project.
Add Syncfusion® Vue Packages
Syncfusion® Vue Chart component packages are available at npmjs.com. To use Syncfusion® Vue components in the project, install the corresponding npm package.
This article uses the Vue Chart component as an example. To use the Vue Chart component in the project, install the @syncfusion/ej2-vue-charts package using:
npm install @syncfusion/ej2-vue-chartsNote: npm v5+ saves packages to
dependenciesby default;--saveis not required.
Add the Syncfusion® Vue Component
Follow the steps below to add the Vue Chart component:
Step 1: First, add the setup attribute to the script tag to indicate that Vue will be using the Composition API, and import the Chart component in the script section of src/app.vue.
<script setup>
import { provide } from 'vue';
import { ChartComponent as EjsChart, SeriesCollectionDirective as ESeriesCollection, SeriesDirective as ESeries, LineSeries, Category } from "@syncfusion/ej2-vue-charts";
</script>
Step 2: Declare the values for the dataSource property in the script section.
<script setup>
const seriesData = [
    { month: 'Jan', sales: 35 }, { month: 'Feb', sales: 28 },
    { month: 'Mar', sales: 34 }, { month: 'Apr', sales: 32 },
    { month: 'May', sales: 40 }, { month: 'Jun', sales: 32 },
    { month: 'Jul', sales: 35 }, { month: 'Aug', sales: 55 },
    { month: 'Sep', sales: 38 }, { month: 'Oct', sales: 30 },
    { month: 'Nov', sales: 25 }, { month: 'Dec', sales: 32 }
];
const primaryXAxis = { valueType: 'Category' };
</script>
Step 3: Register the required chart modules using the provide() method.
<script setup>
// Module injection
provide('chart', [LineSeries, Category]);
</script>
Step 4: In the template section, define the Chart component with the dataSource property.
<template>
    <ejs-chart id="container" :primaryXAxis='primaryXAxis'>
        <e-series-collection>
            <e-series :dataSource='seriesData' type='Line' xName='month' yName='sales' name='Sales'></e-series>
        </e-series-collection>
    </ejs-chart>
</template>
Here is the summarized code for the above steps in the src/app.vue file:
<template>
    <ejs-chart id="container" :primaryXAxis='primaryXAxis'>
        <e-series-collection>
            <e-series :dataSource='seriesData' type='Line' xName='month' yName='sales' name='Sales'></e-series>
        </e-series-collection>
    </ejs-chart>
</template>

<script setup>
import { provide } from 'vue';
import { ChartComponent as EjsChart, SeriesCollectionDirective as ESeriesCollection, SeriesDirective as ESeries, LineSeries, Category } from "@syncfusion/ej2-vue-charts";

// Data source for the chart
const seriesData = [
    { month: 'Jan', sales: 35 }, { month: 'Feb', sales: 28 },
    { month: 'Mar', sales: 34 }, { month: 'Apr', sales: 32 },
    { month: 'May', sales: 40 }, { month: 'Jun', sales: 32 },
    { month: 'Jul', sales: 35 }, { month: 'Aug', sales: 55 },
    { month: 'Sep', sales: 38 }, { month: 'Oct', sales: 30 },
    { month: 'Nov', sales: 25 }, { month: 'Dec', sales: 32 }
];

// Primary X-axis configuration
const primaryXAxis = { valueType: 'Category' };

// Module injection
provide('chart', [LineSeries, Category]);
</script>
Run the Project
To run the project, use the following command:
npm run devOpen the generated local URL (for example, http://localhost:9000) from terminal in the browser. The application displays the chart as shown below:
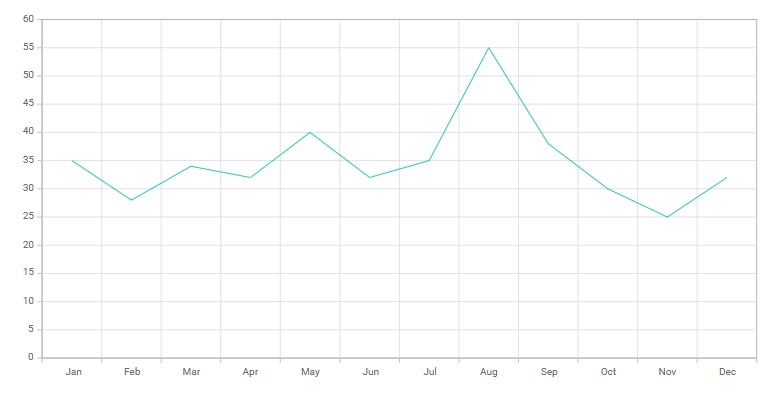
Chart not rendering:
- Ensure that the required chart modules (
LineSeries,Category) are registered usingprovide()in the script section - Verify the
dataSourceis correctly assigned with proper field mappings - Check the browser console (F12 → Console tab) for any error messages
Module not found error:
- Confirm that the module is imported from
@syncfusion/ej2-vue-charts - Verify the module name is spelled correctly in the import statement and
provide()call
Incorrect package version:
- Verify that
@syncfusion/ej2-vue-chartsis compatible with your Quasar and Vue versions - Run
npm list @syncfusion/ej2-vue-chartsto check the installed version
Components not rendering in Quasar layout:
- Ensure the component is placed in a Quasar page file (e.g.,
src/pages/IndexPage.vue) - Check that the component has proper container sizing (add CSS for
#containerheight)
For additional assistance, refer to the Vue Charts API Documentation and the Feature Modules page.