Getting Started with the Vue Accumulation chart Component in Vue 3
18 Nov 201810 minutes to read
This article provides a step-by-step guide for setting up a Vite project with JavaScript and integrating the Syncfusion® Vue Accumulation Chart component using either the Composition API or the Options API.
The Composition API organizes related logic into reusable composition functions and is recommended for larger or composition-oriented code bases. The Options API organizes component logic with data, methods, and life cycle hooks and may be preferable for smaller components or teams familiar with Vue 2 patterns.
Prerequisites
Ensure that the development environment meets the required criteria listed in System requirements for Syncfusion® Vue UI components.
Set Up the Vite Project
A recommended approach for beginning with Vue is to scaffold a project using Vite. To create a new Vite project, use one of the commands that are specific to either NPM or Yarn.
npm
npm create vite@latestyarn
yarn create viteUse the interactive setup and follow these steps:
Step 1: Define the project name. For this article, use my-project.
? Project name: » my-projectStep 2: Select Vue as the framework to create a Vue 3 project.
? Select a framework: » - Use arrow-keys. Return to submit.
Vanilla
> Vue
  React
  Preact
  Lit
  Svelte
  Others
Step 3: Choose JavaScript as the project variant.
? Select a variant: » - Use arrow-keys. Return to submit.
> JavaScript
  TypeScript
  Customize with create-vue ↗
  Nuxt ↗
Step 4: Install dependencies
After the project is created, the CLI prompts you to install dependencies and start the development server:
? Install with <package-manager> and start now?
❯ Yes / No
Select Yes. The CLI automatically navigates to the project directory, installs all required dependencies, and starts the development server.
Now that my-project is ready to run with default settings, let’s add Syncfusion® components to the project.
Add Syncfusion® Vue Packages
Syncfusion® Vue component packages are available at npmjs.com. To use Syncfusion® Vue components in the project, install the corresponding npm package.
This article uses the Vue Accumulation Chart component as an example. To use the Vue Accumulation Chart component in the project, install the @syncfusion/ej2-vue-charts package using either npm or Yarn:
npm
npm install @syncfusion/ej2-vue-chartsyarn
yarn add @syncfusion/ej2-vue-chartsNote: npm v5+ saves packages to
dependenciesby default;--saveis not required.
Add Syncfusion® Vue Accumulation Chart Component
Follow the steps below to add the Vue Accumulation Chart component using Composition API or Options API:
Step 1: First, import and register the Accumulation Chart component and its child directives in the script section of the src/App.vue file. If you are using the Composition API, you should add the setup attribute to the script tag to indicate that Vue will be using the Composition API.
<script setup>
import { provide } from 'vue';
import { AccumulationChartComponent as EjsAccumulationchart, AccumulationSeriesCollectionDirective as EAccumulationSeriesCollection, AccumulationSeriesDirective as EAccumulationSeries, PieSeries } from "@syncfusion/ej2-vue-charts";

let accumulationchart = [PieSeries];
provide('accumulationchart', accumulationchart);
</script><script>
import { AccumulationChartComponent, AccumulationSeriesCollectionDirective, AccumulationSeriesDirective,
PieSeries } from "@syncfusion/ej2-vue-charts";
// Register Chart component and its child directives
export default {
name: "App",
components: {
"ejs-accumulationchart": AccumulationChartComponent,
"e-accumulation-series-collection": AccumulationSeriesCollectionDirective,
"e-accumulation-series": AccumulationSeriesDirective
}
}
</script>Step 2: Declare the values for the dataSource property in the script section.
<script setup>
let data = [
    { x: 'Argentina', y: 505370 },
    { x: 'Belgium', y: 551500 },
    { x: 'Cuba', y: 312685 },
    { x: 'Dominican Republic', y: 350000 },
    { x: 'Egypt', y: 301000 },
    { x: 'Kazakhstan', y: 300000 },
    { x: 'Somalia', y: 357022 }
];
</script><script>
data() {
return {
data: [
{ x: 'Argentina', y: 505370 },
{ x: 'Belgium', y: 551500 },
{ x: 'Cuba', y: 312685 },
{ x: 'Dominican Republic', y: 350000 },
{ x: 'Egypt', y: 301000 },
{ x: 'Kazakhstan', y: 300000 },
{ x: 'Somalia', y: 357022 }
],
};
}
</script>Step 3: In the template section, define the Accumulation Chart component with the dataSource property.
<template>
    <ejs-accumulationchart id="container">
        <e-accumulation-series-collection>
            <e-accumulation-series :dataSource='data' xName='x' yName='y'> </e-accumulation-series>
        </e-accumulation-series-collection>
    </ejs-accumulationchart>
</template>
Here is the summarized code for the above steps in the src/App.vue file:
<template>
    <ejs-accumulationchart id="container">
        <e-accumulation-series-collection>
            <e-accumulation-series :dataSource='data' xName='x' yName='y'> </e-accumulation-series>
        </e-accumulation-series-collection>
    </ejs-accumulationchart>
</template>

<script setup>
import { provide } from 'vue';
import { AccumulationChartComponent as EjsAccumulationchart, AccumulationSeriesCollectionDirective as EAccumulationSeriesCollection, AccumulationSeriesDirective as EAccumulationSeries,
PieSeries } from "@syncfusion/ej2-vue-charts";

let data = [
    { x: 'Argentina', y: 505370 },
    { x: 'Belgium', y: 551500 },
    { x: 'Cuba', y: 312685 },
    { x: 'Dominican Republic', y: 350000 },
    { x: 'Egypt', y: 301000 },
    { x: 'Kazakhstan', y: 300000 },
    { x: 'Somalia', y: 357022 }
];
let accumulationchart = [PieSeries];
provide('accumulationchart', accumulationchart);
</script><template>
<ejs-accumulationchart id="container">
<e-accumulation-series-collection>
<e-accumulation-series :dataSource='data' xName='x' yName='y'> </e-accumulation-series>
</e-accumulation-series-collection>
</ejs-accumulationchart>
</template>
<script>
import { AccumulationChartComponent, AccumulationSeriesCollectionDirective, AccumulationSeriesDirective, PieSeries } from "@syncfusion/ej2-vue-charts";
//Component registration
export default {
name: "App",
components: {
"ejs-accumulationchart": AccumulationChartComponent,
"e-accumulation-series-collection": AccumulationSeriesCollectionDirective,
"e-accumulation-series": AccumulationSeriesDirective
},
data() {
return {
data: [
{ x: 'Argentina', y: 505370 },
{ x: 'Belgium', y: 551500 },
{ x: 'Cuba', y: 312685 },
{ x: 'Dominican Republic', y: 350000 },
{ x: 'Egypt', y: 301000 },
{ x: 'Kazakhstan', y: 300000 },
{ x: 'Somalia', y: 357022 }
],
};
},
provide: {
accumulationchart: [ PieSeries ]
},
};
</script>Run the Project
To run the project, use either npm or Yarn:
npm
npm run devyarn
yarn run dev- Open the project URL shown in the terminal (commonly
http://localhost:5173) and verify the accumulation chart displays correctly.
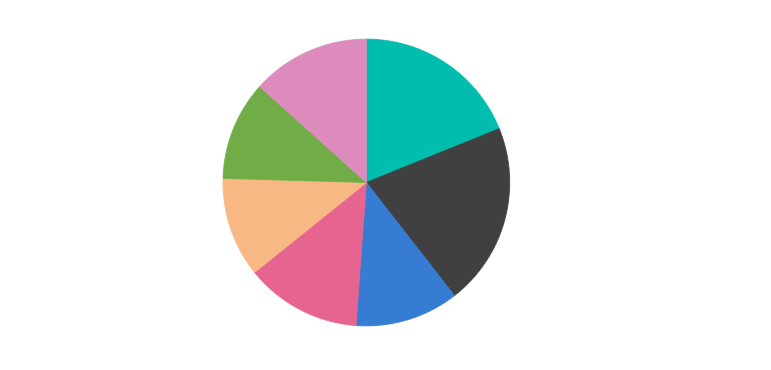
The output will appear as follows:
Troubleshooting (Common Issues)
-
Chart not rendering: Ensure that the required chart modules, such as
PieSeries, are injected usingprovide()in the Composition API or theprovideoption in the Options API. -
Incorrect package version: Verify that the installed
@syncfusion/ej2-vue-chartspackage is compatible with the Vue version used in your project. -
Missing child directives: When using accumulation series directives, ensure that
AccumulationSeriesCollectionDirectiveandAccumulationSeriesDirectiveare imported and registered correctly. -
Console errors: Check the browser console for import or runtime errors, and verify that the required dependencies are installed correctly.
Sample: You can explore the complete sample project in the
vue-3-accumulation-chart-getting-started.
For migrating from Vue 2 to Vue 3, refer to the Vue 3 Migration Guide.