Getting Started with the Vue 3D Chart Component in Vue 3
This article provides a step-by-step guide to setting up a Vite project with JavaScript and integrating the Syncfusion® Vue 3D Chart component using either the Composition API or the Options API.
The Composition API groups related logic into reusable functions and is suitable for larger code bases. The Options API organizes component logic with options such as data, methods, and life cycle hooks. Choose the API that best fits the application’s structure and maintainability requirements.
Prerequisites
Ensure that the development environment meets the system requirements for Syncfusion Vue UI components.
Set Up the Vite Project
Create a Vite project using either npm or yarn.
npm
npm create vite@latest my-app -- --template vueyarn
yarn create vite my-app --template vueIf Vite prompts you to install dependencies and start the project immediately, select No. The Syncfusion package is installed in a later step.
Navigate to the project directory:
cd my-appInstall the project dependencies using either npm or yarn.
npm
npm installyarn
yarn installNow that my-project is ready, add Syncfusion® Vue components to the project.
Note: To create a TypeScript project, use
npm create vite@latest my-app -- --template vue-tsoryarn create vite my-app --template vue-ts.
Add Syncfusion® Vue Package
Syncfusion Vue packages are available on npm.
Install the @syncfusion/ej2-vue-charts package. Use a package release that supports Vue 3 and the Node.js version used by the project.
npm
npm install @syncfusion/ej2-vue-chartsyarn
yarn add @syncfusion/ej2-vue-chartsNote: npm v5+ saves packages to
dependenciesby default;--saveis not required.
Add Syncfusion® Vue 3D Chart Component
Follow these steps to add the Vue 3D Chart component using the Composition API or Options API.
Step 1: Import and Register the Component
Import the 3D Chart component, its child directives, and the modules required by the example in the script section of src/App.vue.
The example uses these modules:
-
ColumnSeries3Drenders the 3D column series. -
Category3Dsupports category values on the horizontal axis.
When using the Composition API, alias the imported component and directive names so they match the custom elements used in the template. Components imported in <script setup> are available directly in the template.
<script setup>
import { provide } from 'vue';
import {
  Chart3DComponent as EjsChart3d,
  Chart3DSeriesCollectionDirective as EChart3dSeriesCollection,
  Chart3DSeriesDirective as EChart3dSeries,
  ColumnSeries3D,
  Category3D
} from '@syncfusion/ej2-vue-charts';

provide('chart3d', [ColumnSeries3D, Category3D]);
</script><script>
import {
Chart3DComponent,
Chart3DSeriesCollectionDirective,
Chart3DSeriesDirective,
ColumnSeries3D,
Category3D
} from '@syncfusion/ej2-vue-charts';
export default {
name: 'App',
components: {
'ejs-chart3d': Chart3DComponent,
'e-chart3d-series-collection': Chart3DSeriesCollectionDirective,
'e-chart3d-series': Chart3DSeriesDirective
},
provide: {
chart3d: [ColumnSeries3D, Category3D]
}
};
</script>Note: The module injection key must be
chart3d. Register only the modules required by the features used in the application.
Step 2: Define the Data and Chart Configuration
Define the chart data and horizontal-axis configuration in the script section.
Because the month field contains category values, set primaryXAxis.valueType to Category and register the Category3D module.
<script setup>
const seriesData = [
  { month: 'Jan', sales: 35 },
  { month: 'Feb', sales: 28 },
  { month: 'Mar', sales: 34 },
  { month: 'Apr', sales: 32 },
  { month: 'May', sales: 40 },
  { month: 'Jun', sales: 32 },
  { month: 'Jul', sales: 35 },
  { month: 'Aug', sales: 55 },
  { month: 'Sep', sales: 38 },
  { month: 'Oct', sales: 30 },
  { month: 'Nov', sales: 25 },
  { month: 'Dec', sales: 32 }
];

const title = 'Sales Analysis';
const primaryXAxis = {
  valueType: 'Category'
};
</script><script>
export default {
data() {
return {
seriesData: [
{ month: 'Jan', sales: 35 },
{ month: 'Feb', sales: 28 },
{ month: 'Mar', sales: 34 },
{ month: 'Apr', sales: 32 },
{ month: 'May', sales: 40 },
{ month: 'Jun', sales: 32 },
{ month: 'Jul', sales: 35 },
{ month: 'Aug', sales: 55 },
{ month: 'Sep', sales: 38 },
{ month: 'Oct', sales: 30 },
{ month: 'Nov', sales: 25 },
{ month: 'Dec', sales: 32 }
],
title: 'Sales Analysis',
primaryXAxis: {
valueType: 'Category'
}
};
}
};
</script>Step 3: Define the 3D Chart in the Template
Add the 3D Chart and its series directives to the template section of src/App.vue.
The series uses the following properties:
-
dataSourcespecifies the array of data objects. -
xNamemaps the category field. -
yNamemaps the numeric field. -
typespecifies the series type.
<template>
  <div id="app">
    <ejs-chart3d
      id="container"
      :title="title"
      :primaryXAxis="primaryXAxis"
    >
      <e-chart3d-series-collection>
        <e-chart3d-series
          :dataSource="seriesData"
          type="Column"
          xName="month"
          yName="sales"
        ></e-chart3d-series>
      </e-chart3d-series-collection>
    </ejs-chart3d>
  </div>
</template>
The following examples combine component registration, module injection, data configuration, and template markup.
<template>
  <div id="app">
    <ejs-chart3d
      id="container"
      :title="title"
      :primaryXAxis="primaryXAxis"
    >
      <e-chart3d-series-collection>
        <e-chart3d-series
          :dataSource="seriesData"
          type="Column"
          xName="month"
          yName="sales"
        ></e-chart3d-series>
      </e-chart3d-series-collection>
    </ejs-chart3d>
  </div>
</template>

<script setup>
import { provide } from 'vue';
import {
  Chart3DComponent as EjsChart3d,
  Chart3DSeriesCollectionDirective as EChart3dSeriesCollection,
  Chart3DSeriesDirective as EChart3dSeries,
  ColumnSeries3D,
  Category3D
} from '@syncfusion/ej2-vue-charts';

const seriesData = [
  { month: 'Jan', sales: 35 },
  { month: 'Feb', sales: 28 },
  { month: 'Mar', sales: 34 },
  { month: 'Apr', sales: 32 },
  { month: 'May', sales: 40 },
  { month: 'Jun', sales: 32 },
  { month: 'Jul', sales: 35 },
  { month: 'Aug', sales: 55 },
  { month: 'Sep', sales: 38 },
  { month: 'Oct', sales: 30 },
  { month: 'Nov', sales: 25 },
  { month: 'Dec', sales: 32 }
];

const title = 'Sales Analysis';
const primaryXAxis = {
  valueType: 'Category'
};

provide('chart3d', [ColumnSeries3D, Category3D]);
</script><template>
<div id="app">
<ejs-chart3d
id="container"
:title="title"
:primaryXAxis="primaryXAxis"
>
<e-chart3d-series-collection>
<e-chart3d-series
:dataSource="seriesData"
type="Column"
xName="month"
yName="sales"
></e-chart3d-series>
</e-chart3d-series-collection>
</ejs-chart3d>
</div>
</template>
<script>
import {
Chart3DComponent,
Chart3DSeriesCollectionDirective,
Chart3DSeriesDirective,
ColumnSeries3D,
Category3D
} from '@syncfusion/ej2-vue-charts';
export default {
name: 'App',
components: {
'ejs-chart3d': Chart3DComponent,
'e-chart3d-series-collection': Chart3DSeriesCollectionDirective,
'e-chart3d-series': Chart3DSeriesDirective
},
provide: {
chart3d: [ColumnSeries3D, Category3D]
},
data() {
return {
seriesData: [
{ month: 'Jan', sales: 35 },
{ month: 'Feb', sales: 28 },
{ month: 'Mar', sales: 34 },
{ month: 'Apr', sales: 32 },
{ month: 'May', sales: 40 },
{ month: 'Jun', sales: 32 },
{ month: 'Jul', sales: 35 },
{ month: 'Aug', sales: 55 },
{ month: 'Sep', sales: 38 },
{ month: 'Oct', sales: 30 },
{ month: 'Nov', sales: 25 },
{ month: 'Dec', sales: 32 }
],
title: 'Sales Analysis',
primaryXAxis: {
valueType: 'Category'
}
};
}
};
</script>Run the Project
Save src/App.vue, and then start the development server.
npm
npm run devyarn
yarn run devOpen the local URL displayed in the terminal, commonly http://localhost:5173, and verify that a 3D column chart titled Sales Analysis displays monthly sales values from January through December.
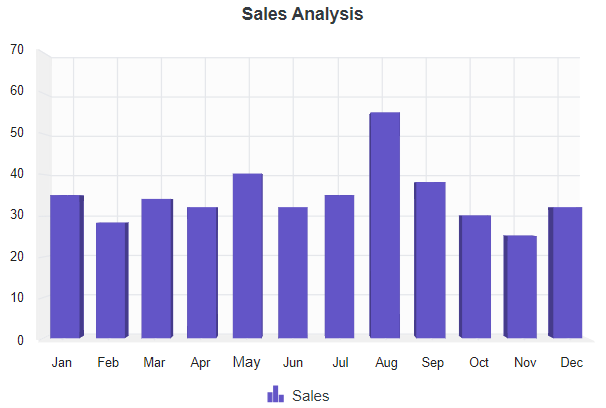
Sample: Explore the Vue 3D Chart getting-started project.
For information about migrating an application from Vue 2 to Vue 3, see the Vue 3 Migration Guide.
Troubleshooting
-
The 3D Chart is not rendered. Verify that the component and both child directives are imported. In the Options API, also verify that they are registered in
components. Check the browser console for component, module, data, or licensing errors. -
The column series is not displayed. Import
ColumnSeries3Dand add it to the array provided with the exactchart3dkey. -
Category values are not displayed correctly. Set
primaryXAxis.valueTypetoCategory, importCategory3D, and provide it with thechart3dkey. -
No data is displayed. Verify that
dataSourcecontains records,xNameandyNamematch fields in each data object, and the field mapped byyNamecontains numeric values. -
An import or runtime error is displayed. Verify that
@syncfusion/ej2-vue-chartsis installed and that its version supports the project’s Vue and Node.js versions.
For additional assistance, refer to the Vue 3D Chart API documentation.