Legend in UWP Smith Chart (SfSmithChart)
The legend contains the list of chart series that appear in a SmithChart. It can be defined by using the following code example.
NOTE
Add a name to the
Labelproperty of Series, which in turn is mapped to the Legend.
<syncfusion:SfSmithChart x:Name="SmithChart">
   <syncfusion:LineSeries Label="Transmission-1" ShowMarker="True" ResistancePath="Resistance" ReactancePath="Reactance" ItemsSource="{Binding Data1}">
   </syncfusion:LineSeries>
   <syncfusion:LineSeries Label="Transmission-2" ShowMarker="True" ResistancePath="Resistance" ReactancePath="Reactance" ItemsSource="{Binding Data2}">
   </syncfusion:LineSeries>

   <!--Adding Legend to SmithChart-->
   <syncfusion:SfSmithChart.Legend>
       <syncfusion:SmithChartLegend></syncfusion:SmithChartLegend>
   </syncfusion:SfSmithChart.Legend>
</syncfusion:SfSmithChart>
SfSmithChart chart = new SfSmithChart();
//Create line series1
LineSeries series1 = new LineSeries();
//Display the legend text for the series.
series1.Label = "Transmission-1";
series1.ItemsSource = Data1;
series1.ResistancePath = "Resistance";
series1.ReactancePath = "Reactance";
series1.ShowMarker = true;
chart.Series.Add(series1);
//Create line series2
LineSeries series2 = new LineSeries();
//Display the legend text for the series.
series2.Label = "Transmission-2";
series2.ItemsSource = Data2;
series2.ResistancePath = "Resistance";
series2.ReactancePath = "Reactance";
series2.ShowMarker = true;
chart.Series.Add(series2);
//Adding legend to the SmithChart
SmithChartLegend legend = new SmithChartLegend();
chart.Legend = legend;
this.Grid1.Children.Add(chart);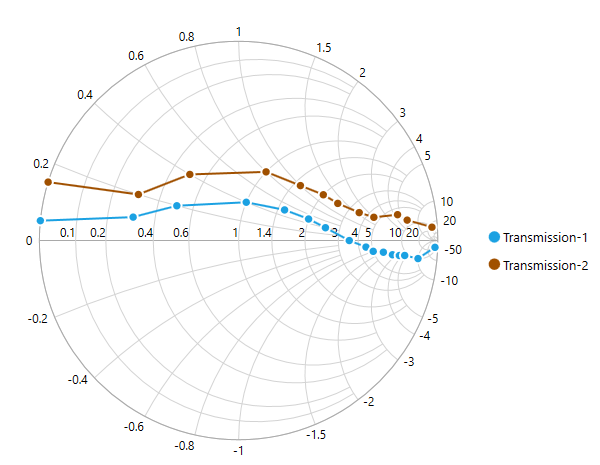
Positioning the legend
Docking
Legends can be docked at left, right, top, or bottom around the chart area by using the DockPosition property.
By default, the Smith chart Legend is docked at the right of the chart.
To display the legend at the bottom, set the DockPosition as Bottom as in the below code snippet.
<syncfusion:SfSmithChart x:Name="SmithChart">
     <!--Adding Legend to SmithChart-->
   <syncfusion:SfSmithChart.Legend>
       <syncfusion:SmithChartLegend DockPosition="Bottom">
       </syncfusion:SmithChartLegend>
   </syncfusion:SfSmithChart.Legend>
</syncfusion:SfSmithChart>
//Adding legend to the SmithChart
SmithChartLegend legend = new SmithChartLegend();
legend.DockPosition = ChartDock.Bottom;
chart.Legend = legend;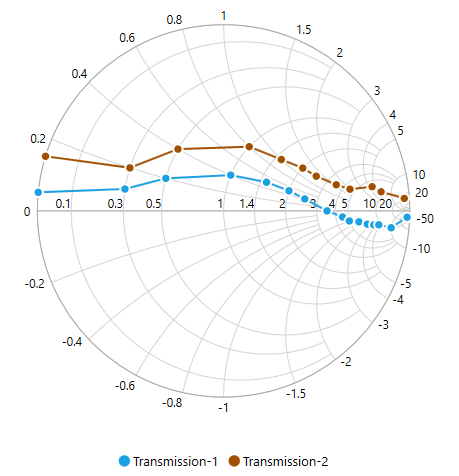
Floating legends
To position the legend at any arbitrary location inside the chart, set DockPosition as Floating and provide its relative position by using OffsetX and OffsetY properties.
Offset specifies x or y distance from origin.
<syncfusion:SfSmithChart x:Name="SmithChart">
  <!--Adding legend to SmithChart-->
  <syncfusion:SfSmithChart.Legend>
    <syncfusion:SmithChartLegend DockPosition="Floating" OffsetX="200" OffsetY="120">
    </syncfusion:SmithChartLegend>
   </syncfusion:SfSmithChart.Legend>
</syncfusion:SfSmithChart>
//Adding legend to the SmithChart
SmithChartLegend legend = new SmithChartLegend();
legend.DockPosition = ChartDock.Floating;
legend.OffsetX = 200;
legend.OffsetY = 120;
chart.Legend = legend;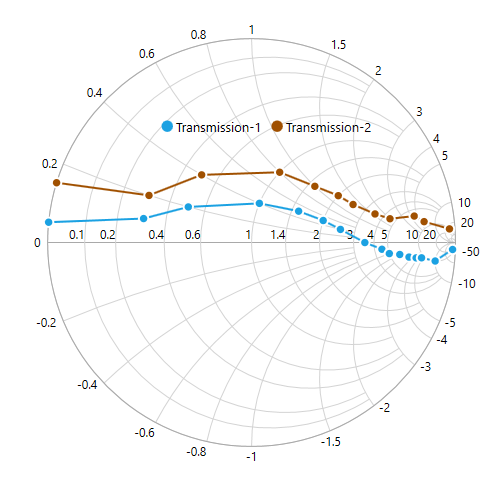
Legend icon
Represents the symbol associated with each legend item. By default, the legend icon is Circle.
The legend icon can be customized by using the LegendIcon property in the Smith chart legend as in the below code snippet:
<syncfusion:SfSmithChart x:Name="SmithChart">
  <!--Adding legend to SmithChart-->
  <syncfusion:SfSmithChart.Legend>
    <syncfusion:SmithChartLegend LegendIcon="HorizontalLine">
    </syncfusion:SmithChartLegend>
   </syncfusion:SfSmithChart.Legend>
</syncfusion:SfSmithChart>
//Adding legend to the SmithChart
SmithChartLegend legend = new SmithChartLegend();
legend.LegendIcon = SmithChartLegendIcon.HorizontalLine;
chart.Legend = legend;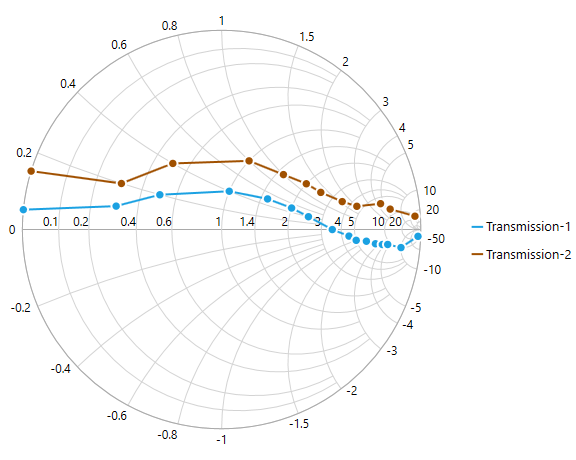
Custom legend icon
A custom icon for the legend can be added by using the LegendIconTemplate property in the Smith chart Legend as in the below code example.
<syncfusion:SfSmithChart x:Name="SmithChart">
 <syncfusion:SfSmithChart.Resources>
        <DataTemplate x:Key="Ellipse">
            <Ellipse Stretch="Fill" Fill="{Binding Interior}" Width="12" Height="5" />
        </DataTemplate>
    </syncfusion:SfSmithChart.Resources>
    <!--Adding custom legend icon to SmithChart-->
    <syncfusion:SfSmithChart.Legend>
        <syncfusion:SmithChartLegend LegendIcon="Custom" LegendIconTemplate="{StaticResource Ellipse}">
    </syncfusion:SmithChartLegend>
   </syncfusion:SfSmithChart.Legend>
</syncfusion:SfSmithChart>
SmithChartLegend legend = new SmithChartLegend();
//Adding custom legend icon to SmithChart
legend.LegendIcon = SmithChartLegendIcon.Custom;
legend.LegendIconTemplate = this.Grid1.Resources["Ellipse"] as DataTemplate;
chart.Legend = legend;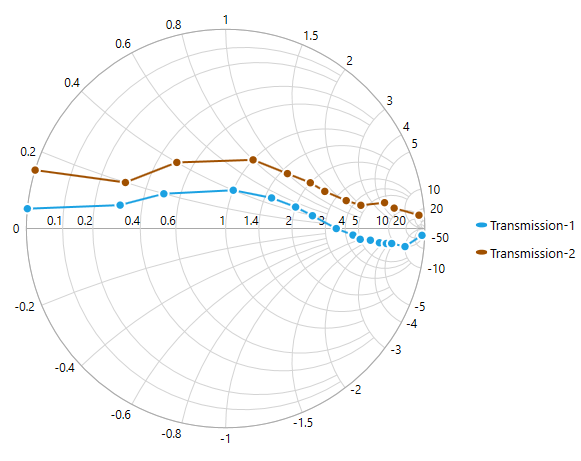
Customizing legend
The following code example illustrates the customization of legend icon and text.
<syncfusion:SfSmithChart x:Name="SmithChart">
  <syncfusion:SfSmithChart.Legend>
        <syncfusion:SmithChartLegend IconHeight="15" IconWidth="15" ItemMargin="10"
                                     FontWeight="Bold" Foreground="Red" FontSize="13"
                                     Background="LightGray" BorderBrush="CadetBlue"
                                     BorderThickness="3">
   </syncfusion:SfSmithChart.Legend>
</syncfusion:SfSmithChart>
//Adding legend to the Smith chart
SmithChartLegend legend = new SmithChartLegend();
//Customizing the Smith chart legend icon
legend.IconHeight = 15;
legend.IconWidth = 15;
legend.ItemMargin = new Thickness(10);
//Customizing legend text
legend.Foreground = new SolidColorBrush(Colors.Red);
legend.FontSize = 13;
legend.FontWeight = FontWeights.Bold;
legend.Background = new SolidColorBrush(Colors.LightSkyBlue);
legend.BorderBrush = new SolidColorBrush(Colors.CadetBlue);
legend.BorderThickness = new Thickness(3);
chart.Legend = legend;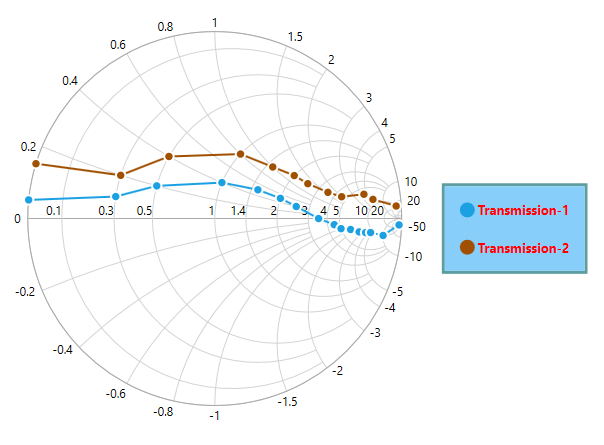
VisibilityOnLegend
To limit the number of series to be displayed in the chart, use the ** property as shown in the below code example.
<syncfusion:SfSmithChart x:Name="SmithChart">
   <syncfusion:LineSeries VisibilityOnLegend="False" Label="Transmission-1" ShowMarker="True" ResistancePath="Resistance" ReactancePath="Reactance" ItemsSource="{Binding Data1}">
   </syncfusion:LineSeries>
   <syncfusion:LineSeries Label="Transmission-2" ShowMarker="True" ResistancePath="Resistance" ReactancePath="Reactance" ItemsSource="{Binding Data2}">
   </syncfusion:LineSeries>
   <syncfusion:SfSmithChart.Legend>
        <syncfusion:SmithChartLegend IconHeight="15" IconWidth="15"
                                     FontWeight="Bold" Foreground="Red" FontSize="13"
                                     Background="LightGray" BorderBrush="CadetBlue"
                                     BorderThickness="3">
        </syncfusion:SmithChartLegend>
   </syncfusion:SfSmithChart.Legend>
</syncfusion:SfSmithChart>
//Create line series1
LineSeries series1 = new LineSeries();
series1.Label = "Transmission-1";
//Remove the LegendItem from legend collections.
series1.VisibilityOnLegend = false;
chart.Series.Add(series1);
//Create line series2
LineSeries series2 = new LineSeries();
series2.Label = "Transmission-2";
chart.Series.Add(series2);
//Adding legend to the SmithChart
SmithChartLegend legend = new SmithChartLegend();
chart.Legend = legend;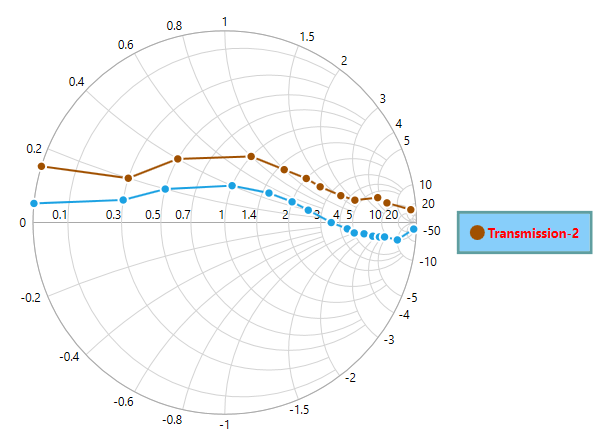
Series visibility
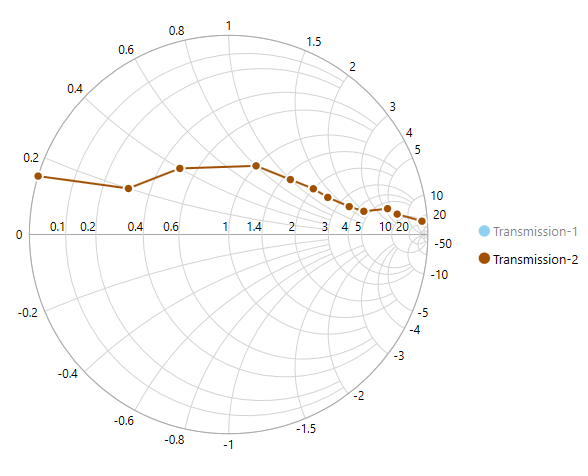
To hide the series segment programmatically, set IsSeriesVisible property as False for the specific series. After the property has been set, the legend item for the specific series will be displayed with shade.
Now, you can show/hide the series segment on chart by clicking on the particular legend item.
<syncfusion:SfSmithChart x:Name="SmithChart">
   <syncfusion:LineSeries IsSeriesVisible="False" Label="Transmission-1" ShowMarker="True" ResistancePath="Resistance" ReactancePath="Reactance" ItemsSource="{Binding Data1}">
   </syncfusion:LineSeries>
   <syncfusion:LineSeries Label="Transmission-2" ShowMarker="True" ResistancePath="Resistance" ReactancePath="Reactance" ItemsSource="{Binding Data2}">
   </syncfusion:LineSeries>
   <syncfusion:SfSmithChart.Legend>
        <syncfusion:SmithChartLegend>
        </syncfusion:SmithChartLegend>
   </syncfusion:SfSmithChart.Legend>
</syncfusion:SfSmithChart>
//Create line series1
LineSeries series1 = new LineSeries();
series1.Label = "Transmission-1";
//Hide the series visibility in Chart.
series1.IsSeriesVisible = false;
chart.Series.Add(series1);
//Create line series2
LineSeries series2 = new LineSeries();
series2.Label = "Transmission-2";
chart.Series.Add(series2);
//Adding legend to the SmithChart
SmithChartLegend legend = new SmithChartLegend();
chart.Legend = legend;