Appearance in UWP Smith Chart (SfSmithChart)
SmithChart palette
The Smith chart displays different series in different colors by using the Palette property of ColorModel. By default, the Metro palette color has been applied.
<syncfusion:SfSmithChart x:Name="SmithChart">
            <syncfusion:SfSmithChart.ColorModel>
                <syncfusion:SmithChartColorModel Palette="BlueChrome" />
            </syncfusion:SfSmithChart.ColorModel>
 </syncfusion:SfSmithChart>
SfSmithChart chart = new SfSmithChart();
chart.ColorModel = new SmithChartColorModel();
chart.ColorModel.Palette = ColorPalette.BlueChrome;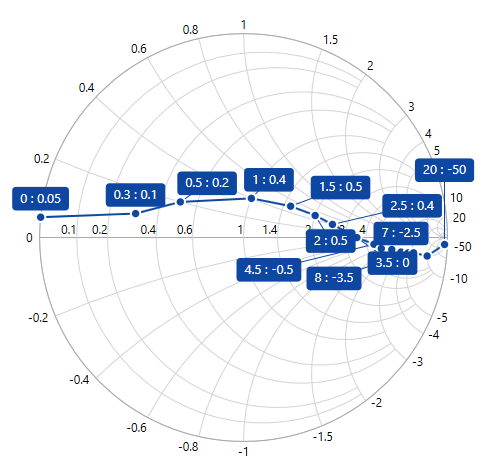
Series palette
The palette color for each data point of a specific series can be defined by using the Palette property of ColorModel in the Series.
<syncfusion:SfSmithChart x:Name="SmithChart">
   <syncfusion:LineSeries>
       <syncfusion:LineSeries.ColorModel>
           <syncfusion:SmithChartColorModel Palette="Metro">
       </syncfusion:LineSeries.ColorModel>
   </syncfusion:LineSeries>
 </syncfusion:SfSmithChart>
LineSeries series = new LineSeries();
series.ColorModel = new SmithChartColorModel();
series.ColorModel.Palette = ColorPalette.Metro;
chart.Series.Add(series);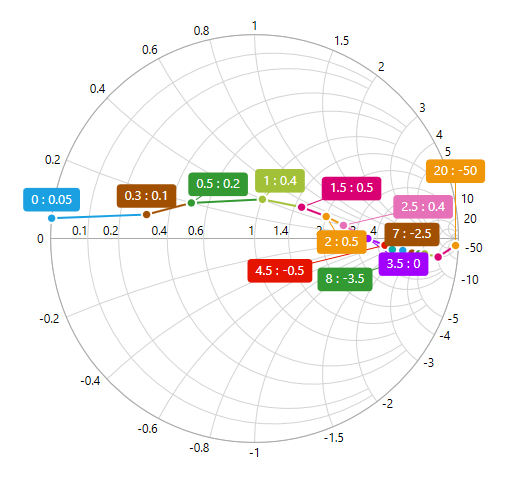
Chart area customization
Chart and chart area (circle plotting area) can be customized by using the below properties in SmithChart.
<syncfusion:SfSmithChart x:Name="SmithChart" Background="LightSteelBlue" BorderBrush="CadetBlue" BorderThickness="4"
                          ChartAreaBackground="AliceBlue" ChartAreaBorderBrush="SkyBlue" ChartAreaBorderThickness="2">
</syncfusion:SfSmithChart>chart.Background = new SolidColorBrush(Colors.LightSteelBlue);
chart.BorderBrush = new SolidColorBrush(Colors.CadetBlue);
chart.BorderThickness = new Thickness(4);
chart.ChartAreaBackground = new SolidColorBrush(Colors.AliceBlue);
chart.ChartAreaBorderBrush = new SolidColorBrush(Colors.SkyBlue);
chart.ChartAreaBorderThickness = new Thickness(2);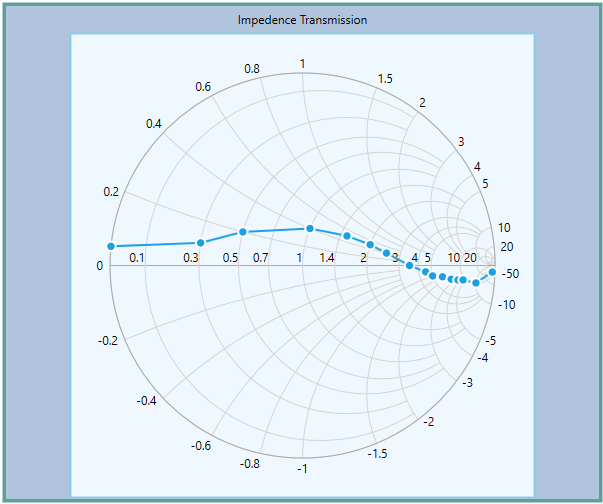
Circle Radius
To change the diameter of the Smith chart circle with respect to the plot area, use the Radius property. It ranges from 0.1 to 1 and the default value is 0.95.
<syncfusion:SfSmithChart x:Name="SmithChart" Radius="0.5" ChartAreaBorderBrush="CadetBlue" />SfSmithChart chart = new SfSmithChart();
//Change the area circle radius value
chart.Radius = 0.5;
chart.ChartAreaBorderBrush = new SolidColorBrush(Colors.CadetBlue);
this.Grid1.Children.Add(chart);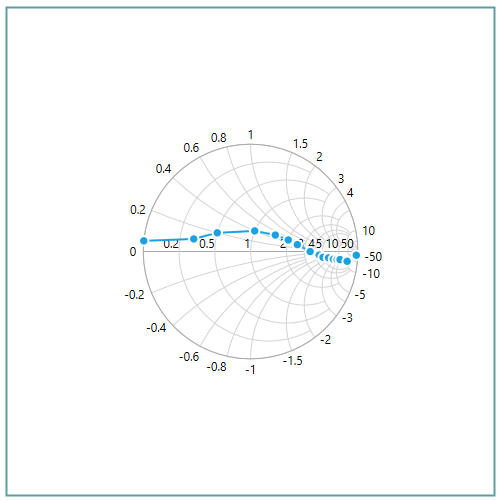
Get smith chart properties
Area bounds
You can get the area bounds of the smith chart by using the AreaBounds property in ChartAreaInfo.
Rect areaBounds = smithChart.ChartAreaInfo.AreaBounds;Center point
You can get the center point (X and Y) of the smith chart by using the CenterPoint property in the ChartAreaInfo.
Point centerPoint = smithChart.ChartAreaInfo.CenterPoint;Radius
You can get the radius of the smith chart by using the Radius property in the ChartAreaInfo.
double radius = smithChart.ChartAreaInfo.Radius;