Getting Started with React Smith Chart
This section describes the steps to create a simple Smith Chart and demonstrates the basic usage of the Smith Chart component.
A quick video overview of the React Smith Charts setup is available:
Prerequisites
Before getting started, ensure that your development environment meets the system requirements for Syncfusion® React UI components. That page documents the supported React, Node.js, and npm versions, and includes the React-version compatibility table for Syncfusion React components.
- Basic knowledge of React and TypeScript (recommended)
- A code editor like Visual Studio Code
Dependencies
Below is the list of minimum dependencies required to use the Smith Chart component. The package under @syncfusion/ej2-react-charts is the only package you need to install explicitly; the rest are installed automatically as transitive dependencies.
  |-- @syncfusion/ej2-react-charts
      |-- @syncfusion/ej2-charts
      |-- @syncfusion/ej2-base
      |-- @syncfusion/ej2-data
      |-- @syncfusion/ej2-svg-base
      |-- @syncfusion/ej2-pdf-export
      |-- @syncfusion/ej2-compression
      |-- @syncfusion/ej2-file-utils
      |-- @syncfusion/ej2-react-base
Installation and configuration
To easily set up a React application, use the Vite CLI (npm create vite), which provides a faster development environment, smaller bundle sizes, and optimized builds compared to traditional tools like create-react-app. For detailed steps, refer to the Vite installation instructions. Vite sets up your environment using JavaScript and optimizes your application for production.
Note: To create a React application using
create-react-appinstead, refer to this documentation for more details.
To create a new React application, run the following command.
npm create vite@latest my-appThis command will prompt you for a few settings for the new project, such as selecting a framework and a variant.
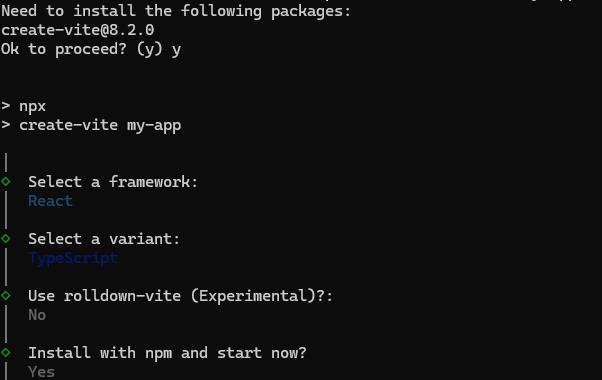
To set up a React application in TypeScript environment, run the following command.
npm create vite@latest my-app -- --template react-ts
cd my-app
To set up a React application in JavaScript environment, run the following command.
npm create vite@latest my-app -- --template react
cd my-app
Install Syncfusion® Smith Chart Package
All the available Essential® JS 2 packages are published in the npmjs.com public registry.
From inside the newly created project directory, install the Syncfusion® Smith Chart package using the following command:
npm install @syncfusion/ej2-react-chartsAdd Smith Chart to the project
Replace the contents of src/App.tsx (for a TypeScript project) or src/App.jsx (for a JavaScript project) with the following code. The example below registers a basic Smith Chart and renders it inside the application’s root element defined in index.html.
import * as React from "react";
import { SmithchartComponent } from '@syncfusion/ej2-react-charts';

function App() {
  return ( <SmithchartComponent></SmithchartComponent> );
}
export default App;
The complete sample below renders a basic Smith Chart with the configuration above.
import * as React from "react";
import * as ReactDOM from "react-dom";
import { SmithchartComponent } from '@syncfusion/ej2-react-charts';

function App() {
    return (<SmithchartComponent id="smithchart"></SmithchartComponent>);
}
export default App;
const root = ReactDOM.createRoot(document.getElementById('smithchart'));
root.render(<App />);
import * as React from "react";
import * as ReactDOM from "react-dom";
import { SmithchartComponent } from '@syncfusion/ej2-react-charts';
function App()Â {
return ( <SmithchartComponent id="smithchart"></SmithchartComponent> );
}
export default App;
const root = ReactDOM.createRoot(document.getElementById('smithchart'));
root.render(<App />);Now run the npm run dev command in the console to start the development server. This command compiles your code and serves the application locally, opening it in the browser.
npm run devModule injection
Smith Chart components are segregated into individual feature-wise modules. In order to use a particular feature, you need to inject its feature service into the component’s services. In the current application, we are going to modify the above basic Smith Chart to visualize transmission lines. For this application we are going to use the tooltip and legend features of the Smith Chart. The relevant feature services are listed below.
-
SmithchartLegend- Inject this module intoservicesto use the legend feature. -
TooltipRender- Inject this module intoservicesto use the tooltip feature.
Import the above-mentioned modules from the chart package and inject them into the services section of the Smith Chart component.
import * as React from "react";
import { SmithchartComponent, SmithchartLegend, TooltipRender, Inject } from '@syncfusion/ej2-react-charts';

function App() {

  return ( <SmithchartComponent id="smithchart" >
      <Inject services={[SmithchartLegend, TooltipRender]} />
    </SmithchartComponent> );

}
export default App;
Add series to Smith Chart
The Smith Chart has two types of specifications for adding series.
-
dataSource— Bind a data object directly by specifyingresistanceandreactancevalues; the series renders from the provided dataSource. -
points— Provide a collection of resistance and reactance value points for the series. Each point must be an object of the shape{ resistance: number, reactance: number }, for example[{ resistance: 0, reactance: 0.5 }, { resistance: 1, reactance: 0 }].
The samples below demonstrate adding two series to the Smith Chart, one for each approach.
- First series
Transmission1shows adataSource-bound series. - Second series
Transmission2shows apoints-bound series.
import * as React from "react";
import * as ReactDOM from "react-dom";
import { SmithchartComponent, SmithchartSeriesCollectionDirective, SmithchartSeriesDirective } from '@syncfusion/ej2-react-charts';
function App() {
    return (<SmithchartComponent id='smithchart'>
                        <SmithchartSeriesCollectionDirective>
                            <SmithchartSeriesDirective points={[
            { resistance: 10, reactance: 25 }, { resistance: 8, reactance: 6 },
            { resistance: 6, reactance: 4.5 }, { resistance: 4.5, reactance: 2 },
            { resistance: 3.5, reactance: 1.6 }, { resistance: 2.5, reactance: 1.3 },
            { resistance: 2, reactance: 1.2 }, { resistance: 1.5, reactance: 1 },
            { resistance: 1, reactance: 0.8 }, { resistance: 0.5, reactance: 0.4 },
            { resistance: 0.3, reactance: 0.2 }, { resistance: 0, reactance: 0.15 },
        ]} name='Transmission1'>
                            </SmithchartSeriesDirective>
                            <SmithchartSeriesDirective points={[
            { resistance: 20, reactance: -50 }, { resistance: 10, reactance: -10 },
            { resistance: 9, reactance: -4.5 }, { resistance: 8, reactance: -3.5 },
            { resistance: 7, reactance: -2.5 }, { resistance: 6, reactance: -1.5 },
            { resistance: 5, reactance: -1 }, { resistance: 4.5, reactance: -0.5 },
            { resistance: 3.5, reactance: 0 }, { resistance: 2.5, reactance: 0.4 },
            { resistance: 2, reactance: 0.5 }, { resistance: 1.5, reactance: 0.5 },
            { resistance: 1, reactance: 0.4 }, { resistance: 0.5, reactance: 0.2 },
            { resistance: 0.3, reactance: 0.1 }, { resistance: 0, reactance: 0.05 },
        ]} name='Transmission2'>
                            </SmithchartSeriesDirective>
                        </SmithchartSeriesCollectionDirective>
            </SmithchartComponent>);
}
;
export default App;
const root = ReactDOM.createRoot(document.getElementById('smithchart'));
root.render(<App />);
import * as React from "react";
import * as ReactDOM from "react-dom";
import { SmithchartComponent, SmithchartSeriesCollectionDirective, SmithchartSeriesDirective } from '@syncfusion/ej2-react-charts';
function App()Â {
return ( <SmithchartComponent id='smithchart'>
<SmithchartSeriesCollectionDirective>
<SmithchartSeriesDirective
points={[
{ resistance: 10, reactance: 25 }, { resistance: 8, reactance: 6 },
{ resistance: 6, reactance: 4.5 }, { resistance: 4.5, reactance: 2 },
{ resistance: 3.5, reactance: 1.6 }, { resistance: 2.5, reactance: 1.3 },
{ resistance: 2, reactance: 1.2 }, { resistance: 1.5, reactance: 1 },
{ resistance: 1, reactance: 0.8 }, { resistance: 0.5, reactance: 0.4 },
{ resistance: 0.3, reactance: 0.2 }, { resistance: 0, reactance: 0.15 },
]} name='Transmission1'
>
</SmithchartSeriesDirective>
<SmithchartSeriesDirective
points={[
{ resistance: 20, reactance: -50 }, { resistance: 10, reactance: -10 },
{ resistance: 9, reactance: -4.5 }, { resistance: 8, reactance: -3.5 },
{ resistance: 7, reactance: -2.5 }, { resistance: 6, reactance: -1.5 },
{ resistance: 5, reactance: -1 }, { resistance: 4.5, reactance: -0.5 },
{ resistance: 3.5, reactance: 0 }, { resistance: 2.5, reactance: 0.4 },
{ resistance: 2, reactance: 0.5 }, { resistance: 1.5, reactance: 0.5 },
{ resistance: 1, reactance: 0.4 }, { resistance: 0.5, reactance: 0.2 },
{ resistance: 0.3, reactance: 0.1 }, { resistance: 0, reactance: 0.05 },
]} name='Transmission2'
>
</SmithchartSeriesDirective>
</SmithchartSeriesCollectionDirective>
</SmithchartComponent> );
};
export default App;
const root = ReactDOM.createRoot(document.getElementById('smithchart'));
root.render(<App />);Troubleshooting
If you encounter issues while setting up or running the Smith Chart, refer to the common problems and solutions below.
-
Blank chart with no series visible — Ensure the
seriesarray is passed toSmithchartComponentand that the injected modules (such asSmithchartLegendorTooltipRender) match the features you have enabled. - License warning in the console — Register a Syncfusion license key as described in the licensing documentation.
-
Module not founderrors during build — Confirm that@syncfusion/ej2-react-chartsis listed underdependenciesinpackage.jsonand thatnpm installhas finished successfully. -
Markers, legend, or tooltip not appearing — Verify that the corresponding module (
SmithchartLegend,TooltipRender, etc.) is included in theservicesarray passed toInject.