Getting Started with React Charts
This section explains how to create a simple Chart component.
Ready to streamline your Syncfusion® React development? Discover the full potential of Syncfusion® React components with Syncfusion® AI Coding Assistant. Effortlessly integrate, configure, and enhance your projects with intelligent, context-aware code suggestions, streamlined setups, and real-time insights—all seamlessly integrated into your preferred AI-powered IDEs like VS Code, Cursor, Syncfusion® CodeStudio and more. Explore Syncfusion® AI Coding Assistant
A quick video overview of the React Charts setup is available:
Prerequisites
- Node.js 24+ (LTS recommended).
- Syncfusion CLI.
Install the Syncfusion CLI
Install the Syncfusion CLI globally using the following command:
npm install -g @syncfusion/syncfusion-cliSet up the Vite project using Syncfusion CLI
You can create a React Vite application using the Syncfusion CLI. The CLI provides two ways to create a project:
Non-interactive mode
Non-interactive mode allows you to create a project directly using a single command with the required command-line arguments.
sf new my-chart-app --framework react --type ts --template chartIn this mode, the project configuration is passed directly in the command. The above command creates a React Vite application configured with the Syncfusion® Chart component.
Interactive mode
Interactive mode guides you through the project creation process with step-by-step prompts.
sfWhen you run the sf command, the CLI prompts you to select the required project configuration. To create a React Vite application with the Syncfusion® Chart component, select the following options:
√ Project name? ... my-chart-app
√ Choose Framework: » React
√ Choose Build Tool: » Vite
√ Choose Language: » Typescript
√ Choose Template: » Chart
√ Choose Theme: » Material3
√ Choose Style Format: » CSS
√ Would you like to integrate the Syncfusion MCP Server (AI Assistant) into this project? ... no
√ Would you like to install Syncfusion Component Skills for AI-powered development? ... no
√ Install dependencies and start app now? ... no
The above selections generate a React Vite application configured with the Syncfusion® Chart component. You can choose different values for language, theme, style format, MCP setup, and skills installation based on your project requirements.
The Syncfusion® CLI creates the project with a predefined template. After the project is generated, you can customize or replace the component code based on your application requirements.
Run the project
Once the project is created, navigate to the project directory and run the following commands in your terminal.
cd my-chart-app
npm install
npm run dev
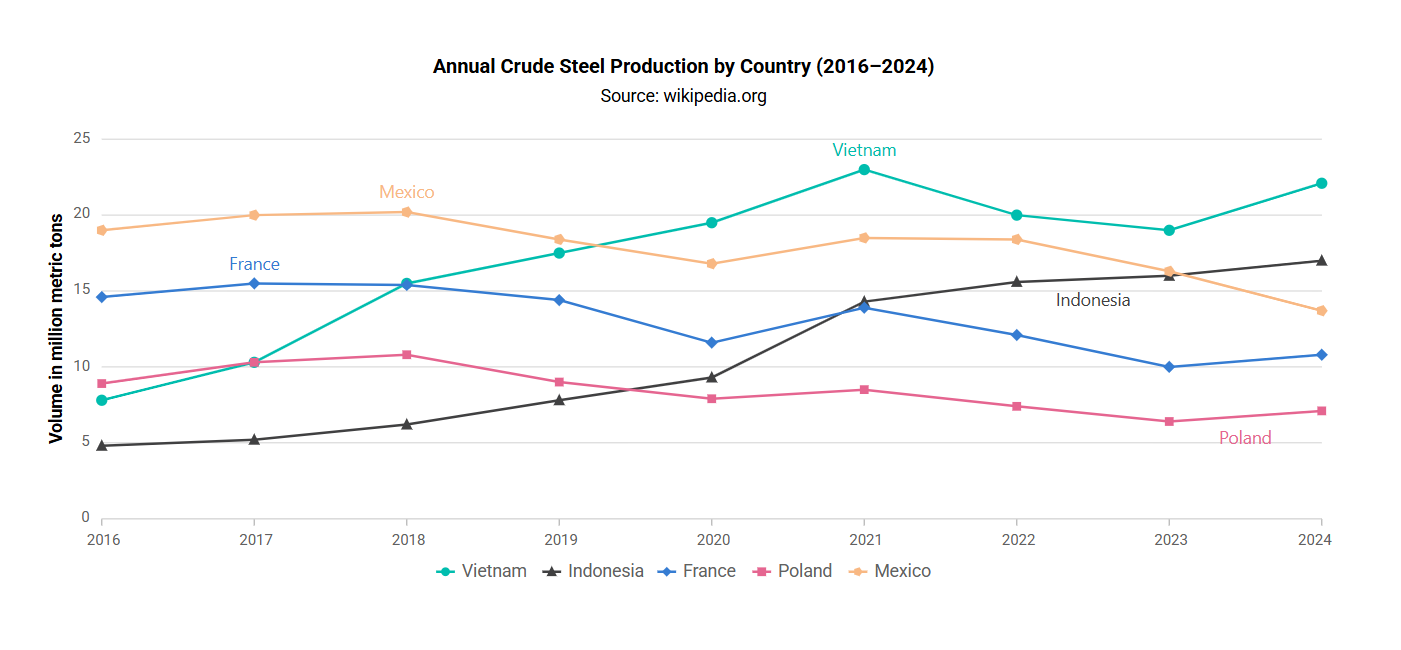
The output will appear as follows:
Prerequisites
Before getting started, ensure that your development environment meets the system requirements for Syncfusion React UI components. That page documents the supported React, Node.js, and npm versions, and includes the React-version compatibility table for Syncfusion React components.
Before You Begin
This guide uses the React application structure generated by Vite with the TypeScript template. The following files are part of that scaffold and work together as follows:
-
src/App.tsx— Defines the root React component that hosts the Chart component. This is the only file edited in this guide. -
src/main.tsx— Application entry point that rendersAppinto the#rootelement defined inindex.html. -
index.html— Root HTML file that contains the#rootcontainer element used to mount the React application.
Note: In a Vite React TypeScript application, the root component is commonly generated as
src/App.tsx. If your application uses JavaScript, the equivalent file is typicallysrc/App.jsx.
Note: This guide uses the TypeScript template for better type checking with Chart models.
Installation and configuration
Note: As an alternative, you can create a React application using
create-react-app. For detailed instructions, refer to this documentation.
Step 1: Create a React application with Vite
Use Vite to create and manage React applications. Vite provides a fast development environment and optimized builds for modern React applications. Syncfusion® React documentation also recommends Vite for setting up React applications.
Start by opening a terminal on your system (Command Prompt, PowerShell, or Terminal). You may work from the default C: drive location or create a new folder and open the terminal in it.
Step 2: Create a React application
Create a new React application using the below command.
npm create vite@latest my-chart-app -- --template react-ts
If Vite prompts you to install dependencies and start the project immediately, choose No. The Syncfusion package is installed in a later step.
Navigate to the project folder:
cd my-chart-app
Install the application dependencies:
npm install
Note: If you prefer JavaScript instead of TypeScript, create the application using
npm create vite@latest my-chart-app -- --template react.
Step 3: Install the Syncfusion® React Chart package
All Syncfusion Essential® JS 2 packages are published to the npm registry.
Install the React Chart package using the following command:
npm install @syncfusion/ej2-react-charts
Installing
@syncfusion/ej2-react-chartsautomatically pulls in the required peer dependencies (for example,@syncfusion/ej2-baseand@syncfusion/ej2-charts).
After the install completes, run npm install once more if the package is not yet listed in package.json. Then open the project in your IDE to continue with the next step.
Step 4: Add the Chart component to the project
Add the Chart component to src/App.tsx using the following code.
import { ChartComponent } from '@syncfusion/ej2-react-charts';
function App() {
  return (<ChartComponent />);
}
export default App;
Note: Running
npm run dev(Step 7) at this point renders an empty chart area. Continue with the next steps to inject modules, add data, and configure a series so the chart can render the data.
Step 5: Inject required modules
Chart features are delivered as separate modules and must be explicitly injected. The Inject component takes a services array that registers the modules the Chart component is allowed to use; injecting only the modules you need keeps the bundle small. Here, the LineSeries and Category modules are used to render monthly sales data:
-
LineSeries— Inject this module intoservicesto render a line series. -
Category— Inject this module intoservicesto enable the category axis.
Import the modules from the Chart package and register them through the Inject component as follows.
import { ChartComponent, LineSeries, Category, Inject } from '@syncfusion/ej2-react-charts';
function App() {
    return <ChartComponent>
    <Inject services={[LineSeries, Category]}/>
  </ChartComponent>;
}
export default App;
Note: At this stage, no series are rendered because the Chart component has not yet been configured with a data source.
Step 6: Populate the Chart with data
Chart data should be provided as a JSON array in the following format. You can define the data in the same src/App.tsx file or place it in a separate file (for example, src/datasource.ts) and import it into App.tsx.
export const data: Object[] = [
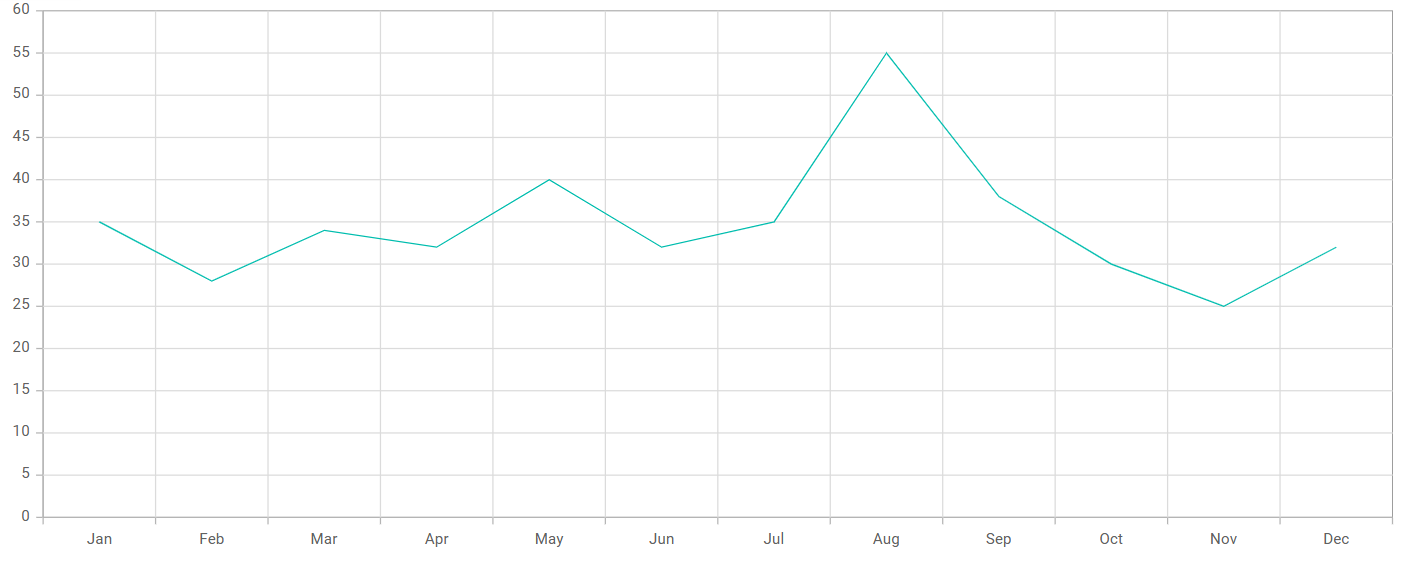
    { month: 'Jan', sales: 35 }, { month: 'Feb', sales: 28 },
    { month: 'Mar', sales: 34 }, { month: 'Apr', sales: 32 },
    { month: 'May', sales: 40 }, { month: 'Jun', sales: 32 },
    { month: 'Jul', sales: 35 }, { month: 'Aug', sales: 55 },
    { month: 'Sep', sales: 38 }, { month: 'Oct', sales: 30 },
    { month: 'Nov', sales: 25 }, { month: 'Dec', sales: 32 }
];
After defining the required data set, bind the data to the Chart component in the SeriesDirective tag. The following code snippet demonstrates the complete configuration required to render a basic chart.
import * as React from 'react';
import { createRoot } from 'react-dom/client';
import {
  ChartComponent,
  Inject,
  SeriesCollectionDirective,
  SeriesDirective,
  Category,
  LineSeries,
  Legend,
} from '@syncfusion/ej2-react-charts';

const data = [
  { month: 'Jan', sales: 35 },
  { month: 'Feb', sales: 28 },
  { month: 'Mar', sales: 34 },
  { month: 'Apr', sales: 32 },
  { month: 'May', sales: 40 },
  { month: 'Jun', sales: 32 },
  { month: 'Jul', sales: 35 },
  { month: 'Aug', sales: 55 },
  { month: 'Sep', sales: 38 },
  { month: 'Oct', sales: 30 },
  { month: 'Nov', sales: 25 },
  { month: 'Dec', sales: 32 },
];
const xAxisCategory = { valueType: 'Category' };

function App() {
  return (
    <ChartComponent id="charts" primaryXAxis={xAxisCategory}>
      <Inject services={[LineSeries, Category, Legend]} />
      <SeriesCollectionDirective>
        <SeriesDirective
          dataSource={data}
          xName="month"
          yName="sales"
          name="Sales"
          type="Line"
        />
      </SeriesCollectionDirective>
    </ChartComponent>
  );
}
export default App;
const root = createRoot(document.getElementById('charts'));
root.render(<App />);
import * as React from "react";
import { createRoot } from 'react-dom/client';
import { ChartComponent, Inject, SeriesCollectionDirective, SeriesDirective, Category, LineSeries } from '@syncfusion/ej2-react-charts';
const data: Object[] = [
{ month: 'Jan', sales: 35 }, { month: 'Feb', sales: 28 },
{ month: 'Mar', sales: 34 }, { month: 'Apr', sales: 32 },
{ month: 'May', sales: 40 }, { month: 'Jun', sales: 32 },
{ month: 'Jul', sales: 35 }, { month: 'Aug', sales: 55 },
{ month: 'Sep', sales: 38 }, { month: 'Oct', sales: 30 },
{ month: 'Nov', sales: 25 }, { month: 'Dec', sales: 32 }
];
const xAxisCategory = { valueType: 'Category' };
function App() {
return <ChartComponent id="charts" primaryXAxis={xAxisCategory}>
<Inject services={[LineSeries, Category]} />
<SeriesCollectionDirective>
<SeriesDirective dataSource={data} xName='month' yName='sales' name='Sales' type='Line'/>
</SeriesCollectionDirective>
</ChartComponent>
}
export default App;
const root = createRoot(document.getElementById('charts'));
root.render(<App />);Step 7: Run the application
Run the application using the following command:
npm run dev
Open the generated local URL (for example, localhost:5173/) from terminal in the browser. The application displays the chart as shown below:
Troubleshooting
Use the following guidance to resolve common issues when getting started with the React Chart component.
-
Chart does not render (blank page)
- Verify that
index.htmlcontains a container withid="root", and thatmain.tsx(ormain.jsx) callscreateRoot(document.getElementById("root")!).render(<App />). - Run
npm installagain to ensure all peer dependencies are installed.
- Verify that
-
Chart area renders but no series is displayed
- Confirm that the required series module (for example,
LineSeriesorColumnSeries) and axis module (for example,CategoryorDateTime) are listed in theservicesarray of theInjectcomponent. - Confirm that
<SeriesDirective>is wrapped in a<SeriesCollectionDirective>and thatdataSource,xName,yName, andtypeare set.
- Confirm that the required series module (for example,
-
Series data is plotted in the wrong order or with wrong labels
- Check that the property names passed to
xNameandyNameexactly match the keys in thedataSourcearray (the comparison is case-sensitive). - If the
xfield holdsDatevalues, set thevalueTypeofprimaryXAxistoDateTime; for string categories useCategory.
- Check that the property names passed to
-
Module not found: Can't resolve '@syncfusion/ej2-react-charts'- The package was not installed in the current project. Run
npm install @syncfusion/ej2-react-chartsfrom the project root.
- The package was not installed in the current project. Run
-
Tooltip, legend, or data label is not visible after enabling it
- Confirm that the corresponding module (for example,
Tooltip,Legend,DataLabel) is included in theservicesarray of theInjectcomponent.
- Confirm that the corresponding module (for example,
See also
Explore the following related topics: