Getting Started with React Charts in Next.js
This section provides a step-by-step guide for setting up a Next.js application and integrating the React Charts component.
Prerequisites
Before getting started with the Next.js application, ensure the following prerequisites are met:
- Node.js 18.17 or later (required by Next.js 14/15).
- Next.js 14 or 15.
- React 18 or 19.
-
@syncfusion/ej2-react-charts30.x or later (compatible with React 18/19).
Step 1: Create a Next.js application
This guide uses the Next.js App Router. To create a new Next.js application, use one of the commands that are specific to either NPM or Yarn.
npx create-next-app@latestyarn create next-appUsing one of the above commands will lead you to set up additional configurations for the project as below:
- Define the project name: Users can specify the name of the project directly. Let’s specify the name of the project as
ej2-nextjs-chart. When prompted, also select TypeScript: Yes so that the project uses the App Router with asrc/app/page.tsxfile.
√ What is your project named? » ej2-nextjs-chart- Select the required packages.
√ Would you like to use the recommended Next.js defaults? » Yes, use recommended defaultsBy selecting the recommended Next.js defaults, all essential Next.js packages (App Router, TypeScript, ESLint, and Tailwind CSS) will be installed.
- Once the project is created, navigate to the project directory using the following command:
cd ej2-nextjs-chartThe application is ready to run with default settings. Now, let’s add Syncfusion® components to the project.
Step 2: Install Syncfusion® React packages
Syncfusion® React component packages are available at npmjs.com. To use Syncfusion® React components in the project, install the corresponding npm package.
Here, the React Chart component is used in the project. To install the React Chart component, use the following command:
npm install @syncfusion/ej2-react-chartsyarn add @syncfusion/ej2-react-chartsStep 3: Add the Chart component
Replace the contents of src/app/page.tsx with the following code. The example below uses typed data and renders the chart as columns.
To register a Syncfusion license, call
registerLicense('YOUR_LICENSE_KEY')from@syncfusion/ej2-baseat app startup. To apply a theme, import a stylesheet such as@syncfusion/ej2-react-charts/styles/material.css. Both are optional during local development but required for production builds.
'use client';
import {
  Category,
  ChartComponent,
  ColumnSeries,
  Inject,
  SeriesCollectionDirective,
  SeriesDirective,
} from '@syncfusion/ej2-react-charts';


export default function Home() {
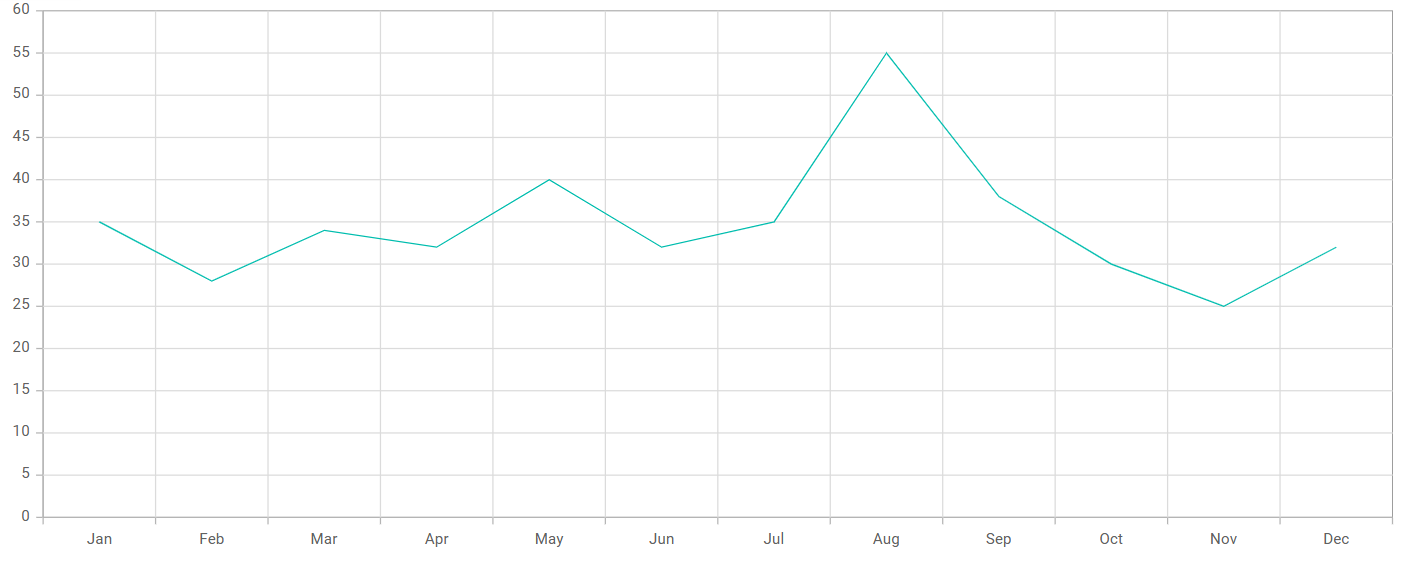
  const data = [
    { month: 'Jan', sales: 35 }, { month: 'Feb', sales: 28 },
    { month: 'Mar', sales: 34 }, { month: 'Apr', sales: 32 },
    { month: 'May', sales: 40 }, { month: 'Jun', sales: 32 },
    { month: 'Jul', sales: 35 }, { month: 'Aug', sales: 55 },
    { month: 'Sep', sales: 38 }, { month: 'Oct', sales: 30 },
    { month: 'Nov', sales: 25 }, { month: 'Dec', sales: 32 },
  ];
  // `as const` narrows the string literal to 'Category', matching Syncfusion's `ValueType` union type.
  const primaryXAxis = { valueType: 'Category' } as const;

  return (
    <ChartComponent id="charts" primaryXAxis={primaryXAxis}>
      <Inject services={[ColumnSeries, Category]} />
      <SeriesCollectionDirective>
        <SeriesDirective
          dataSource={data}
          xName="month"
          yName="sales"
          name="Sales"
          type="Column"
        />
      </SeriesCollectionDirective>
    </ChartComponent>
  );
}
Step 4: Run the application
To run the application, use the following command:
npm run devyarn run devOpen the URL printed in the terminal (for example, http://localhost:3000) in a browser. If port 3000 is already in use, Next.js falls back to the next available port (for example, http://localhost:3001). The application displays the chart as shown in the following image:
To learn more about the functionality of the Chart component, refer to the React Chart documentation.
Troubleshooting
-
Chart does not render (blank page)
- Confirm
src/app/page.tsxbegins with'use client';. - Confirm
registerLicense('YOUR_LICENSE_KEY')is called with a valid key from the Syncfusion License Dashboard. A missing or invalid key still renders, but logs a console warning. - Verify that a theme stylesheet (for example,
@syncfusion/ej2-react-charts/styles/material.css) is imported.
- Confirm
-
Module not found: Can't resolve '@syncfusion/ej2-react-charts'- Run
npm install @syncfusion/ej2-react-charts(oryarn add @syncfusion/ej2-react-charts) in the project root.
- Run
-
Hydration mismatch /
use clienterror- Chart uses browser-only APIs and must be rendered in a Client Component. Ensure the file that exports the component begins with
'use client';and that the component is not imported into a Server Component.
- Chart uses browser-only APIs and must be rendered in a Client Component. Ensure the file that exports the component begins with
-
Port 3000 is already in use
- Next.js automatically falls back to the next available port (3001, 3002, and so on). Use the URL printed in the terminal output.