How can I help you?
Render chart control based on cell selection
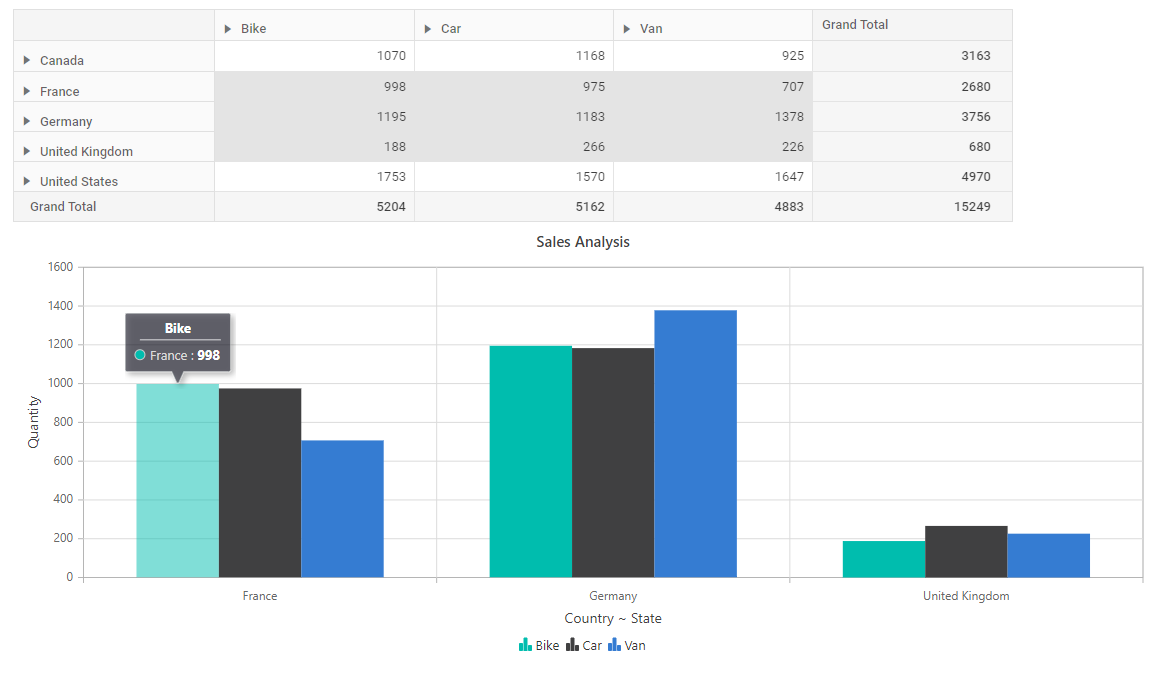
The ASP.NET MVC Pivot Table component supports creating charts based on cell selections within the pivot table. This customization allows charts to be plotted dynamically using data from selected cells, providing visual representation of specific data segments.
Configuration
Cell selection is enabled using the AllowSelection property. The selection behavior is configured through the PivotViewSelectionSettings property to define selection type and mode.
Implementation
The CellSelected event triggers when cells are selected in the pivot table. This event provides selected cell information including row header name, column header name, measure name, and values. Using this data, the chart control can be plotted accordingly.