Bubble HeatMap in ASP.NET Core HeatMap Chart Component
18 Nov 20182 minutes to read
The cell customizations and color mapping for rect tile type is defined in appearance and palette sections in detail.
Bubble types
In bubble HeatMap, you can display the data points with bubble size, bubble colors, and sector attributes of the bubble.
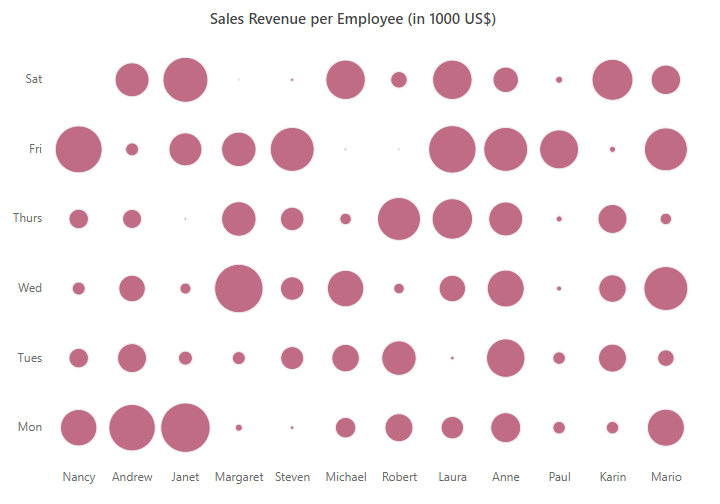
Bubble size
In this bubble HeatMap type, the size factor of the bubble is used to denote the data variations. The radius of the bubble varies according to data values.
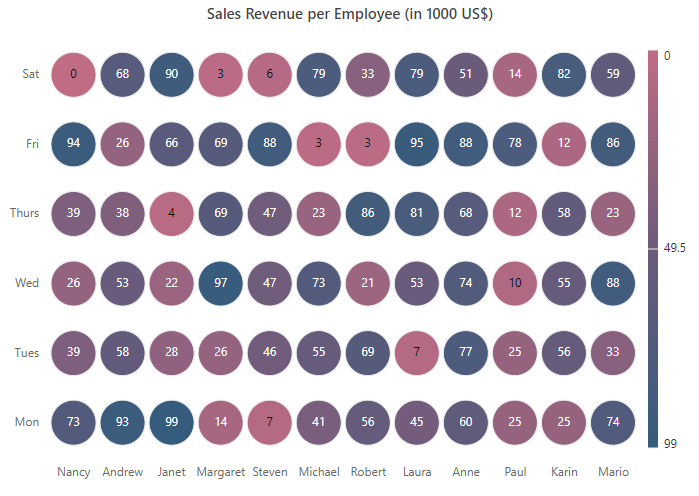
Bubble color
In HeatMap, defined with this tile type, the data points will be represented with same sized bubbles and the data value variations are represented with the bubble colors.
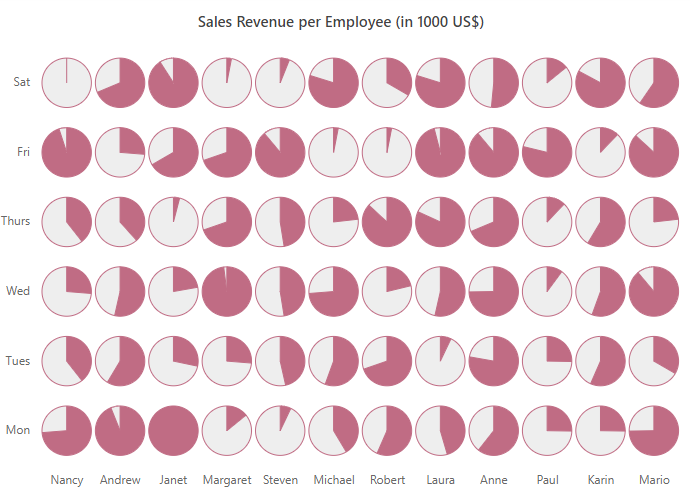
Bubble sector
In this bubble HeatMap type, the sector of the bubble decides the magnitude of data point. If the sector is large, then the data point value will be high.
Combining size and color bubble types
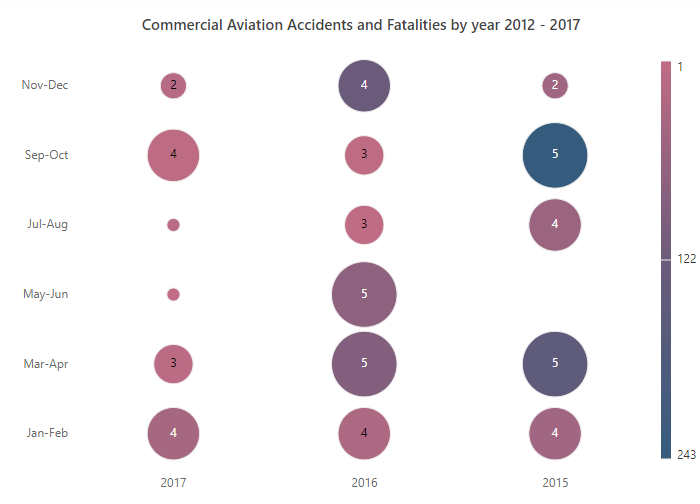
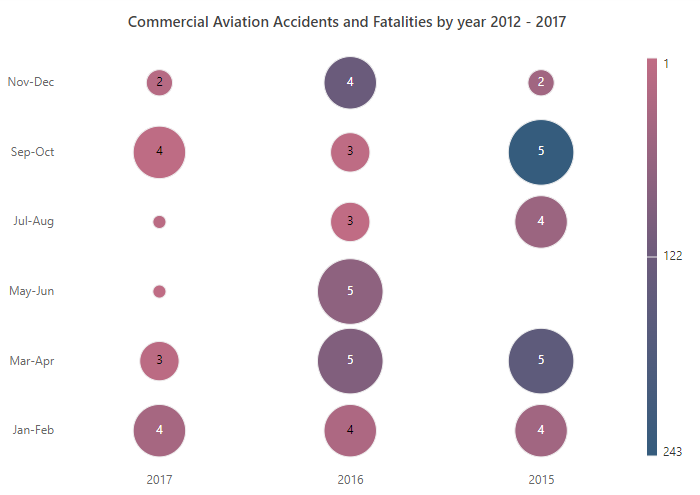
The following examples demonstrate different data binding with the SizeAndColor bubble type set in the HeatMap.
Array binding
When an array of numbers is specified as the data source, the bubble HeatMap can be rendered with different sizes and colors depending on the bound data.
Table
The following example illustrates how to render a bubble HeatMap with different sizes and colors using array table binding.

Cell
The following example illustrates how to render a bubble HeatMap with different sizes and colors using array cell binding.
JSON binding
When a list of JSON objects are specified as data source, the bubble HeatMap can be rendered with different sizes and colors depending on the bound data.
Table
The following example illustrates how to render a bubble HeatMap with different sizes and colors using JSON table binding.
Cell
The following example illustrates how to render a bubble HeatMap with different sizes and colors using JSON cell binding.

Binding size and color values from datasource