Appearance in ASP.NET Core HeatMap Chart
Cell customization
You can customize the cell by using the cellSettings property.
Border
Change the width, color, and radius of the heat map cells by using the border property.
<ejs-heatmap id='container' dataSource="ViewBag.dataSource">
  <e-heatmap-titlesettings text="Sales Revenue per Employee (in 1000 US$)" textStyle="ViewBag.textStyle">
  </e-heatmap-titlesettings>
  <e-heatmap-xaxis labels="ViewBag.xLabels">
  </e-heatmap-xaxis>
  <e-heatmap-yaxis labels="ViewBag.yLabels">
  </e-heatmap-yaxis>
  <e-heatmap-cellsettings border="ViewBag.border"></e-heatmap-cellsettings>
</ejs-heatmap>
public ActionResult Border()
{
ViewBag.textStyle = new
{
size= "15px",
fontWeight= "500",
fontStyle= "Normal",
fontFamily= "Segoe UI"
};
string[] xlabels = new string[12] { "Nancy", "Andrew", "Janet", "Margaret", "Steven", "Michael", "Robert", "Laura", "Anne", "Paul", "Karin", "Mario" };
ViewBag.xLabels = xlabels;
string[] yLabels = new string[6] { "Mon", "Tues", "Wed", "Thurs", "Fri", "Sat" };
ViewBag.yLabels = yLabels;
ViewBag.dataSource = GetDataSource();
ViewBag.border = new { width = 1,radius = 4, color= "white" };
return View();
}
private int[,] GetDataSource()
{
int[,] data = new int[,]
{
{73, 39, 26, 39, 94, 0},
{93, 58, 53, 38, 26, 68},
{99, 28, 22, 4, 66, 90},
{14, 26, 97, 69, 69, 3},
{7, 46, 47, 47, 88, 6},
{41, 55, 73, 23, 3, 79},
{56, 69, 21, 86, 3, 33},
{45, 7, 53, 81, 95, 79},
{60, 77, 74, 68, 88, 51},
{25, 25, 10, 12, 78, 14},
{25, 56, 55, 58, 12, 82},
{74, 33, 88, 23, 86, 59}
};
return data;
}Cell highlighting
Enable or disable the cell highlighting while hovering over the heatmap cells by using the enableCellHighlighting property.
The cell highlighting only works in a SVG rendering mode.
<ejs-heatmap id='container' dataSource="ViewBag.dataSource">
  <e-heatmap-titlesettings text="Sales Revenue per Employee (in 1000 US$)" textStyle="ViewBag.textStyle">
  </e-heatmap-titlesettings>
  <e-heatmap-xaxis labels="ViewBag.xLabels">
  </e-heatmap-xaxis>
  <e-heatmap-yaxis labels="ViewBag.yLabels">
  </e-heatmap-yaxis>
  <e-heatmap-cellsettings enableCellHighlighting="true"></e-heatmap-cellsettings>
</ejs-heatmap>
public ActionResult CellHighlight()
{
ViewBag.textStyle = new
{
size= "15px",
fontWeight= "500",
fontStyle= "Normal",
fontFamily= "Segoe UI"
};
string[] xlabels = new string[12] { "Nancy", "Andrew", "Janet", "Margaret", "Steven", "Michael", "Robert", "Laura", "Anne", "Paul", "Karin", "Mario" };
ViewBag.xLabels = xlabels;
string[] yLabels = new string[6] { "Mon", "Tues", "Wed", "Thurs", "Fri", "Sat" };
ViewBag.yLabels = yLabels;
ViewBag.dataSource = GetDataSource();
return View();
}
private int[,] GetDataSource()
{
int[,] data = new int[,]
{
{73, 39, 26, 39, 94, 0},
{93, 58, 53, 38, 26, 68},
{99, 28, 22, 4, 66, 90},
{14, 26, 97, 69, 69, 3},
{7, 46, 47, 47, 88, 6},
{41, 55, 73, 23, 3, 79},
{56, 69, 21, 86, 3, 33},
{45, 7, 53, 81, 95, 79},
{60, 77, 74, 68, 88, 51},
{25, 25, 10, 12, 78, 14},
{25, 56, 55, 58, 12, 82},
{74, 33, 88, 23, 86, 59}
};
return data;
}Color gradient mode
The colorGradientMode property can be used to set the minimum and maximum values for colors based on row and column. Three types of color gradient modes are available.
- Table: The minimum and maximum value colors calculated for overall data.
- Row: The minimum and maximum value colors calculated for each row of data.
- Column: The minimum and maximum value colors calculated for each column of data.
The default value of
ColorGradientModeis Table.
<ejs-heatmap id='container' dataSource="ViewBag.dataSource">
  <e-heatmap-titlesettings text="Sales Revenue per Employee (in 1000 US$)" textStyle="ViewBag.textStyle">
  </e-heatmap-titlesettings>
  <e-heatmap-xaxis labels="ViewBag.xLabels">
  </e-heatmap-xaxis>
  <e-heatmap-yaxis labels="ViewBag.yLabels">
  </e-heatmap-yaxis>
  <e-heatmap-palettesettings colorGradientMode="Column">
  </e-heatmap-palettesettings>
  <e-heatmap-cellsettings enableCellHighlighting="true"></e-heatmap-cellsettings>
</ejs-heatmap>
public ActionResult CellHighlight()
{
ViewBag.textStyle = new
{
size= "15px",
fontWeight= "500",
fontStyle= "Normal",
fontFamily= "Segoe UI"
};
string[] xlabels = new string[12] { "Nancy", "Andrew", "Janet", "Margaret", "Steven", "Michael", "Robert", "Laura", "Anne", "Paul", "Karin", "Mario" };
ViewBag.xLabels = xlabels;
string[] yLabels = new string[6] { "Mon", "Tues", "Wed", "Thurs", "Fri", "Sat" };
ViewBag.yLabels = yLabels;
ViewBag.dataSource = GetDataSource();
return View();
}
private int[,] GetDataSource()
{
int[,] data = new int[,]
{
{73, 39, 26, 39, 94, 0},
{93, 58, 53, 38, 26, 68},
{99, 28, 22, 4, 66, 90},
{14, 26, 97, 69, 69, 3},
{7, 46, 47, 47, 88, 6},
{41, 55, 73, 23, 3, 79},
{56, 69, 21, 86, 3, 33},
{45, 7, 53, 81, 95, 79},
{60, 77, 74, 68, 88, 51},
{25, 25, 10, 12, 78, 14},
{25, 56, 55, 58, 12, 82},
{74, 33, 88, 23, 86, 59}
};
return data;
}Background color
The background color of the HeatMap can be customized using the backgroundColor property.
<ejs-heatmap id='container' dataSource="ViewBag.dataSource" backgroundColor="#c7afcf">
  <e-heatmap-titlesettings text="Sales Revenue per Employee (in 1000 US$)" textStyle="ViewBag.textStyle">
  </e-heatmap-titlesettings>
  <e-heatmap-xaxis labels="ViewBag.xLabels">
  </e-heatmap-xaxis>
  <e-heatmap-yaxis labels="ViewBag.yLabels">
  </e-heatmap-yaxis>
</ejs-heatmap>
public ActionResult BackgroundColor()
{
ViewBag.textStyle = new
{
size= "15px",
fontWeight= "500",
fontStyle= "Normal",
fontFamily= "Segoe UI"
};
string[] xlabels = new string[12] { "Nancy", "Andrew", "Janet", "Margaret", "Steven", "Michael", "Robert", "Laura", "Anne", "Paul", "Karin", "Mario" };
ViewBag.xLabels = xlabels;
string[] yLabels = new string[6] { "Mon", "Tues", "Wed", "Thurs", "Fri", "Sat" };
ViewBag.yLabels = yLabels;
ViewBag.dataSource = GetDataSource();
return View();
}
private int[,] GetDataSource()
{
int[,] data = new int[,]
{
{73, 39, 26, 39, 94, 0},
{93, 58, 53, 38, 26, 68},
{99, 28, 22, 4, 66, 90},
{14, 26, 97, 69, 69, 3},
{7, 46, 47, 47, 88, 6},
{41, 55, 73, 23, 3, 79},
{56, 69, 21, 86, 3, 33},
{45, 7, 53, 81, 95, 79},
{60, 77, 74, 68, 88, 51},
{25, 25, 10, 12, 78, 14},
{25, 56, 55, 58, 12, 82},
{74, 33, 88, 23, 86, 59}
};
return data;
}Margin
Set the margin for the heatmap from its container by using the margin property.
<ejs-heatmap id='container' dataSource="ViewBag.dataSource">
  <e-heatmap-margin left="15" right="15" top="15" bottom="15"></e-heatmap-margin>
  <e-heatmap-titlesettings text="Sales Revenue per Employee (in 1000 US$)" textStyle="ViewBag.textStyle">
  </e-heatmap-titlesettings>
  <e-heatmap-xaxis labels="ViewBag.xLabels">
  </e-heatmap-xaxis>
  <e-heatmap-yaxis labels="ViewBag.yLabels">
  </e-heatmap-yaxis>
</ejs-heatmap>
public ActionResult Margin()
{
ViewBag.textStyle = new
{
size= "15px",
fontWeight= "500",
fontStyle= "Normal",
fontFamily= "Segoe UI"
};
string[] xlabels = new string[12] { "Nancy", "Andrew", "Janet", "Margaret", "Steven", "Michael", "Robert", "Laura", "Anne", "Paul", "Karin", "Mario" };
ViewBag.xLabels = xlabels;
string[] yLabels = new string[6] { "Mon", "Tues", "Wed", "Thurs", "Fri", "Sat" };
ViewBag.yLabels = yLabels;
ViewBag.dataSource = GetDataSource();
return View();
}
private int[,] GetDataSource()
{
int[,] data = new int[,]
{
{73, 39, 26, 39, 94, 0},
{93, 58, 53, 38, 26, 68},
{99, 28, 22, 4, 66, 90},
{14, 26, 97, 69, 69, 3},
{7, 46, 47, 47, 88, 6},
{41, 55, 73, 23, 3, 79},
{56, 69, 21, 86, 3, 33},
{45, 7, 53, 81, 95, 79},
{60, 77, 74, 68, 88, 51},
{25, 25, 10, 12, 78, 14},
{25, 56, 55, 58, 12, 82},
{74, 33, 88, 23, 86, 59}
};
return data;
}Title
The title is used to provide a quick information about the data plotted in heatmap. The text property is used to set the title for the heatmap. The text style of the title can be customized by using the textStyle property.
<ejs-heatmap id='container' dataSource="ViewBag.dataSource">
  <e-heatmap-titlesettings text="Sales Revenue per Employee (in 1000 US$)" textStyle="ViewBag.textStyle">
  </e-heatmap-titlesettings>
  <e-heatmap-xaxis labels="ViewBag.xLabels">
  </e-heatmap-xaxis>
  <e-heatmap-yaxis labels="ViewBag.yLabels">
  </e-heatmap-yaxis>
</ejs-heatmap>
public ActionResult Title()
{
ViewBag.textStyle = new
{
size= "15px",
fontWeight= "500",
fontStyle= "Italic",
fontFamily= "Segoe UI"
};
string[] xlabels = new string[12] { "Nancy", "Andrew", "Janet", "Margaret", "Steven", "Michael", "Robert", "Laura", "Anne", "Paul", "Karin", "Mario" };
ViewBag.xLabels = xlabels;
string[] yLabels = new string[6] { "Mon", "Tues", "Wed", "Thurs", "Fri", "Sat" };
ViewBag.yLabels = yLabels;
ViewBag.dataSource = GetDataSource();
return View();
}
private int[,] GetDataSource()
{
int[,] data = new int[,]
{
{73, 39, 26, 39, 94, 0},
{93, 58, 53, 38, 26, 68},
{99, 28, 22, 4, 66, 90},
{14, 26, 97, 69, 69, 3},
{7, 46, 47, 47, 88, 6},
{41, 55, 73, 23, 3, 79},
{56, 69, 21, 86, 3, 33},
{45, 7, 53, 81, 95, 79},
{60, 77, 74, 68, 88, 51},
{25, 25, 10, 12, 78, 14},
{25, 56, 55, 58, 12, 82},
{74, 33, 88, 23, 86, 59}
};
return data;
}Data label
The visibility of data labels can be toggled using the showLabel property. By default, the data labels will be visible.
<ejs-heatmap id='container' dataSource="ViewBag.dataSource">
  <e-heatmap-titlesettings text="Sales Revenue per Employee (in 1000 US$)" textStyle="ViewBag.textStyle">
  </e-heatmap-titlesettings>
  <e-heatmap-xaxis labels="ViewBag.xLabels">
  </e-heatmap-xaxis>
  <e-heatmap-yaxis labels="ViewBag.yLabels">
  </e-heatmap-yaxis>
  <e-heatmap-cellsettings showLabel="false"></e-heatmap-cellsettings>
</ejs-heatmap>
public ActionResult DataLabel()
{
ViewBag.textStyle = new
{
size= "15px",
fontWeight= "500",
fontStyle= "Normal",
fontFamily= "Segoe UI"
};
string[] xlabels = new string[12] { "Nancy", "Andrew", "Janet", "Margaret", "Steven", "Michael", "Robert", "Laura", "Anne", "Paul", "Karin", "Mario" };
ViewBag.xLabels = xlabels;
string[] yLabels = new string[6] { "Mon", "Tues", "Wed", "Thurs", "Fri", "Sat" };
ViewBag.yLabels = yLabels;
ViewBag.dataSource = GetDataSource();
return View();
}
private int[,] GetDataSource()
{
int[,] data = new int[,]
{
{73, 39, 26, 39, 94, 0},
{93, 58, 53, 38, 26, 68},
{99, 28, 22, 4, 66, 90},
{14, 26, 97, 69, 69, 3},
{7, 46, 47, 47, 88, 6},
{41, 55, 73, 23, 3, 79},
{56, 69, 21, 86, 3, 33},
{45, 7, 53, 81, 95, 79},
{60, 77, 74, 68, 88, 51},
{25, 25, 10, 12, 78, 14},
{25, 56, 55, 58, 12, 82},
{74, 33, 88, 23, 86, 59}
};
return data;
}Customize the data label
The label displayed in the HeatMap cell can be changed using the cellRender event.
<ejs-heatmap id='container' dataSource="ViewBag.dataSource" cellRender="window.onHeatmapCellRender">
  <e-heatmap-titlesettings text="Sales Revenue per Employee (in 1000 US$)" textStyle="ViewBag.textStyle">
  </e-heatmap-titlesettings>
  <e-heatmap-xaxis labels="ViewBag.xLabels">
  </e-heatmap-xaxis>
  <e-heatmap-yaxis labels="ViewBag.yLabels">
  </e-heatmap-yaxis>
</ejs-heatmap>

<script>
  window.onHeatmapCellRender = function (args) {
      args.displayText = (args.value) + '$';
  };
</script>
public ActionResult CellRender()
{
ViewBag.textStyle = new
{
size= "15px",
fontWeight= "500",
fontStyle= "Normal",
fontFamily= "Segoe UI"
};
string[] xlabels = new string[12] { "Nancy", "Andrew", "Janet", "Margaret", "Steven", "Michael", "Robert", "Laura", "Anne", "Paul", "Karin", "Mario" };
ViewBag.xLabels = xlabels;
string[] yLabels = new string[6] { "Mon", "Tues", "Wed", "Thurs", "Fri", "Sat" };
ViewBag.yLabels = yLabels;
ViewBag.dataSource = GetDataSource();
return View();
}
private int[,] GetDataSource()
{
int[,] data = new int[,]
{
{73, 39, 26, 39, 94, 0},
{93, 58, 53, 38, 26, 68},
{99, 28, 22, 4, 66, 90},
{14, 26, 97, 69, 69, 3},
{7, 46, 47, 47, 88, 6},
{41, 55, 73, 23, 3, 79},
{56, 69, 21, 86, 3, 33},
{45, 7, 53, 81, 95, 79},
{60, 77, 74, 68, 88, 51},
{25, 25, 10, 12, 78, 14},
{25, 56, 55, 58, 12, 82},
{74, 33, 88, 23, 86, 59}
};
return data;
}Text style
The text attributes of the data label such as font-family, font-size, and color can be customized using the textStyle in the cellSettings property.
<ejs-heatmap id='container' dataSource="ViewBag.dataSource ">
  <e-heatmap-titlesettings text="Sales Revenue per Employee (in 1000 US$)" textStyle="ViewBag.textStyle">
  </e-heatmap-titlesettings>
  <e-heatmap-xaxis labels="ViewBag.xLabels">
  </e-heatmap-xaxis>
  <e-heatmap-yaxis labels="ViewBag.yLabels">
  </e-heatmap-yaxis>
  <e-heatmap-cellsettings textStyle="ViewBag.cellTextStyle"></e-heatmap-cellsettings>
</ejs-heatmap>
public ActionResult TextStyle()
{
ViewBag.textStyle = new
{
size= "15px",
fontWeight= "500",
fontStyle= "Normal",
fontFamily= "Segoe UI"
};
string[] xlabels = new string[12] { "Nancy", "Andrew", "Janet", "Margaret", "Steven", "Michael", "Robert", "Laura", "Anne", "Paul", "Karin", "Mario" };
ViewBag.xLabels = xlabels;
string[] yLabels = new string[6] { "Mon", "Tues", "Wed", "Thurs", "Fri", "Sat" };
ViewBag.yLabels = yLabels;
ViewBag.dataSource = GetDataSource();
ViewBag.cellTextStyle = new { fontStyle = "Italic",fontFamily = "Segoe UI"};
return View();
}
private int[,] GetDataSource()
{
int[,] data = new int[,]
{
{73, 39, 26, 39, 94, 0},
{93, 58, 53, 38, 26, 68},
{99, 28, 22, 4, 66, 90},
{14, 26, 97, 69, 69, 3},
{7, 46, 47, 47, 88, 6},
{41, 55, 73, 23, 3, 79},
{56, 69, 21, 86, 3, 33},
{45, 7, 53, 81, 95, 79},
{60, 77, 74, 68, 88, 51},
{25, 25, 10, 12, 78, 14},
{25, 56, 55, 58, 12, 82},
{74, 33, 88, 23, 86, 59}
};
return data;
}Format
The format of the data label, such as currency, decimal, percent etc. can be changed using format property.
<ejs-heatmap id='container' dataSource="ViewBag.dataSource">
  <e-heatmap-titlesettings text="Sales Revenue per Employee (in 1000 US$)" textStyle="ViewBag.textStyle">
  </e-heatmap-titlesettings>
  <e-heatmap-xaxis labels="ViewBag.xLabels">
  </e-heatmap-xaxis>
  <e-heatmap-yaxis labels="ViewBag.yLabels">
  </e-heatmap-yaxis>
  <e-heatmap-cellsettings  format="{value} $"></e-heatmap-cellsettings>
</ejs-heatmap>
public ActionResult Format()
{
ViewBag.textStyle = new
{
size= "15px",
fontWeight= "500",
fontStyle= "Normal",
fontFamily= "Segoe UI"
};
string[] xlabels = new string[12] { "Nancy", "Andrew", "Janet", "Margaret", "Steven", "Michael", "Robert", "Laura", "Anne", "Paul", "Karin", "Mario" };
ViewBag.xLabels = xlabels;
string[] yLabels = new string[6] { "Mon", "Tues", "Wed", "Thurs", "Fri", "Sat" };
ViewBag.yLabels = yLabels;
ViewBag.dataSource = GetDataSource();
return View();
}
private int[,] GetDataSource()
{
int[,] data = new int[,]
{
{73, 39, 26, 39, 94, 0},
{93, 58, 53, 38, 26, 68},
{99, 28, 22, 4, 66, 90},
{14, 26, 97, 69, 69, 3},
{7, 46, 47, 47, 88, 6},
{41, 55, 73, 23, 3, 79},
{56, 69, 21, 86, 3, 33},
{45, 7, 53, 81, 95, 79},
{60, 77, 74, 68, 88, 51},
{25, 25, 10, 12, 78, 14},
{25, 56, 55, 58, 12, 82},
{74, 33, 88, 23, 86, 59}
};
return data;
}Template
Any HTML elements can be added as a template in the data labels by using the labelTemplate property of cellSettings in the HeatMap.
The following examples show various data binding methods in the HeatMap using the labelTemplate property.
Array binding
By including ${value} in the template content, the value from the data source for the corresponding cell can be displayed in the HeatMap cell as data label template content. Additionally, the x-axis and y-axis label values can be displayed by including ${xLabel} and ${yLabel} in the template content.
Table
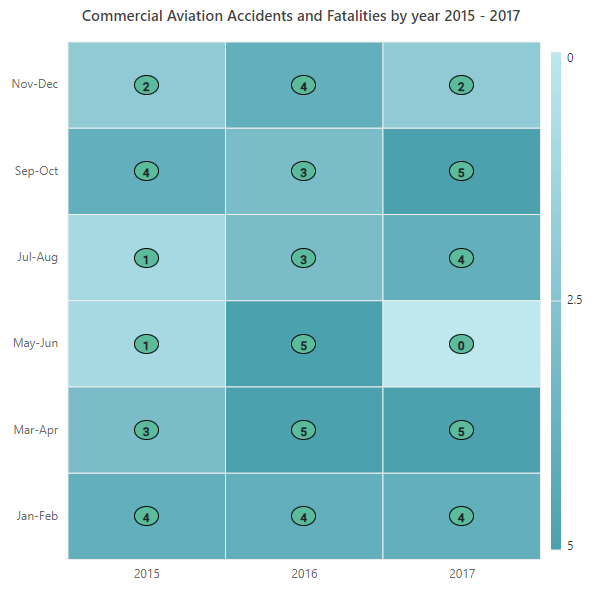
The following example demonstrates how to add a data label template for array table binding.
<ejs-heatmap id='container' showTooltip="true" load="onHeatmapLoad">
    <e-heatmap-titlesettings text="Commercial Aviation Accidents and Fatalities by year 2015 - 2017"
        textStyle="ViewBag.textStyle">
    </e-heatmap-titlesettings>
    <e-heatmap-xaxis labels="ViewBag.xLabels">
    </e-heatmap-xaxis>
    <e-heatmap-yaxis labels="ViewBag.yLabels">
    </e-heatmap-yaxis>
    <e-heatmap-cellsettings
        labelTemplate="<div style='width:25px;height:20px;text-align:center;padding-top:2px;background-color:#5BBB9C; border: 1px solid #000000; border-radius:50%;font-weight:bold;'>${value}</div>"></e-heatmap-cellsettings>
    <e-heatmap-legendsettings visible="true"></e-heatmap-legendsettings>
</ejs-heatmap>

<script>
    var dataSource = [
        [[4, 39], [3, 8], [1, 3], [1, 10], [4, 4], [2, 15]],
        [[4, 28], [5, 92], [5, 73], [3, 1], [3, 4], [4, 126]],
        [[4, 45], [5, 152], [0, 44], [4, 54], [5, 243], [2, 45]]
    ];

    window.onHeatmapLoad = function (args) {
        args.heatmap.dataSource = dataSource;
    }


</script>
public ActionResult Gradient()
{
ViewBag.textStyle = new
{
size = "15px",
fontWeight = "500",
fontStyle = "Normal",
fontFamily = "Segoe UI"
};
string[] xlabels = new string[3] { "2015", "2016", "2017" };
ViewBag.xLabels = xlabels;
string[] yLabels = new string[6] { "Jan-Feb", "Mar-Apr", "May-Jun", "Jul-Aug", "Sep-Oct", "Nov-Dec" };
ViewBag.yLabels = yLabels;
return View();
}
Cell
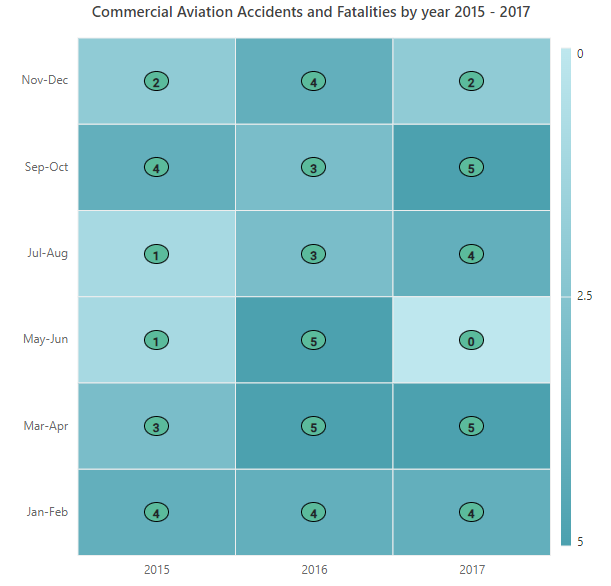
The following example demonstrates how to add a data label template for array cell binding.
<ejs-heatmap id='container' showTooltip="true" load="onHeatmapLoad">
    <e-heatmap-titlesettings text="Commercial Aviation Accidents and Fatalities by year 2015 - 2017"
        textStyle="ViewBag.textStyle">
    </e-heatmap-titlesettings>
    <e-heatmap-xaxis labels="ViewBag.xLabels">
    </e-heatmap-xaxis>
    <e-heatmap-yaxis labels="ViewBag.yLabels">
    </e-heatmap-yaxis>
    <e-heatmap-cellsettings
        labelTemplate="<div style='width:25px;height:20px;text-align:center;padding-top:2px;background-color:#5BBB9C; border: 1px solid #000000; border-radius:50%;font-weight:bold;'>${value}</div>"></e-heatmap-cellsettings>
    <e-heatmap-datasourcesettings isJsonData="false" adaptorType="Cell"></e-heatmap-datasourcesettings>
    <e-heatmap-legendsettings visible="true"></e-heatmap-legendsettings>
</ejs-heatmap>

<script>
    var dataSource = [
        [0, 0, [4, 39]], [0, 1, [3, 8]], [0, 2, [1, 3]], [0, 3, [1, 10]], [0, 4, [4, 4]], [0, 5, [2, 15]],
        [1, 0, [4, 28]], [1, 1, [5, 92]], [1, 2, [5, 73]], [1, 3, [3, 1]], [1, 4, [3, 4]], [1, 5, [4, 126]],
        [2, 0, [4, 45]], [2, 1, [5, 152]], [2, 2, [0, 44]], [2, 3, [4, 54]], [2, 4, [5, 243]], [2, 5, [2, 45]]
    ];

    window.onHeatmapLoad = function (args) {
        args.heatmap.dataSource = dataSource;
    }

</script>
public ActionResult Gradient()
{
ViewBag.textStyle = new
{
size = "15px",
fontWeight = "500",
fontStyle = "Normal",
fontFamily = "Segoe UI"
};
string[] xlabels = new string[3] { "2015", "2016", "2017" };
ViewBag.xLabels = xlabels;
string[] yLabels = new string[6] { "Jan-Feb", "Mar-Apr", "May-Jun", "Jul-Aug", "Sep-Oct", "Nov-Dec" };
ViewBag.yLabels = yLabels;
return View();
}
JSON binding
By including the desired field name in the template content, such as ${value}, the value from the data source for the corresponding cell can be displayed in the HeatMap cell as data label template content.
Table
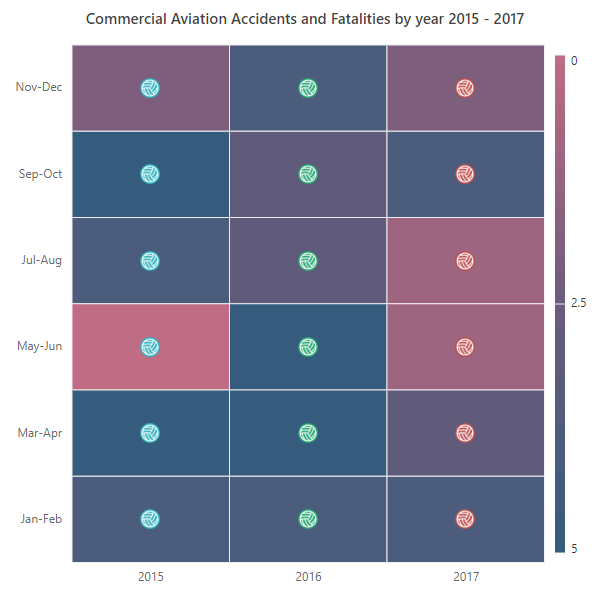
The following example demonstrates how to add a data label template for JSON table binding.
<ejs-heatmap id='container' showTooltip="true" load="onHeatmapLoad">
  <e-heatmap-titlesettings text="Commercial Aviation Accidents and Fatalities by year 2015 - 2017"
    textStyle="ViewBag.textStyle">
  </e-heatmap-titlesettings>
  <e-heatmap-xaxis labels="ViewBag.xLabels">
  </e-heatmap-xaxis>
  <e-heatmap-yaxis labels="ViewBag.yLabels">
  </e-heatmap-yaxis>
  <e-heatmap-palettesettings type="Gradient">
    <e-palettes>
      <e-palette color="#C06C84"></e-palette>
      <e-palette color="#6C5B7B"></e-palette>
      <e-palette color="#355C7D"></e-palette>
    </e-palettes>
  </e-heatmap-palettesettings>
  <e-heatmap-cellsettings
    labelTemplate="<div><img style='width:20px;height:20px;' src='${image}'/> </div>"></e-heatmap-cellsettings>
  <e-heatmap-legendsettings visible="true"></e-heatmap-legendsettings>
  <e-heatmap-datasourcesettings isJsonData="true" adaptorType="Table"
    xDataMapping="Year"></e-heatmap-datasourcesettings>
</ejs-heatmap>

<script>
  var dataSource = [
    {
      Year: '2017',
      image:
        'https://ej2.syncfusion.com/demos/src/circular-gauge/images/golfball.png',
      'Jan-Feb': [4, 39],
      'Mar-Apr': [3, 8],
      'May-Jun': [1, 3],
      'Jul-Aug': [1, 10],
      'Sep-Oct': [4, 4],
      'Nov-Dec': [2, 15]
    },
    {
      Year: '2016',
      image:
        'https://ej2.syncfusion.com/demos/src/circular-gauge/images/basketball.png',
      'Jan-Feb': [4, 28],
      'Mar-Apr': [5, 92],
      'May-Jun': [5, 73],
      'Jul-Aug': [3, 1],
      'Sep-Oct': [3, 4],
      'Nov-Dec': [4, 126]
    },
    {
      Year: '2015',
      image:
        'https://ej2.syncfusion.com/demos/src/circular-gauge/images/football.png',
      'Jan-Feb': [4, 45],
      'Mar-Apr': [5, 152],
      'May-Jun': [0, 44],
      'Jul-Aug': [4, 54],
      'Sep-Oct': [5, 243],
      'Nov-Dec': [2, 45]
    }
  ];
  window.onHeatmapLoad = function (args) {
    args.heatmap.dataSource = dataSource;
  }

</script>
public ActionResult Gradient()
{
ViewBag.textStyle = new
{
size = "15px",
fontWeight = "500",
fontStyle = "Normal",
fontFamily = "Segoe UI"
};
string[] xlabels = new string[3] { "2015", "2016", "2017" };
ViewBag.xLabels = xlabels;
string[] yLabels = new string[6] { "Jan-Feb", "Mar-Apr", "May-Jun", "Jul-Aug", "Sep-Oct", "Nov-Dec" };
ViewBag.yLabels = yLabels;
return View();
}
Cell
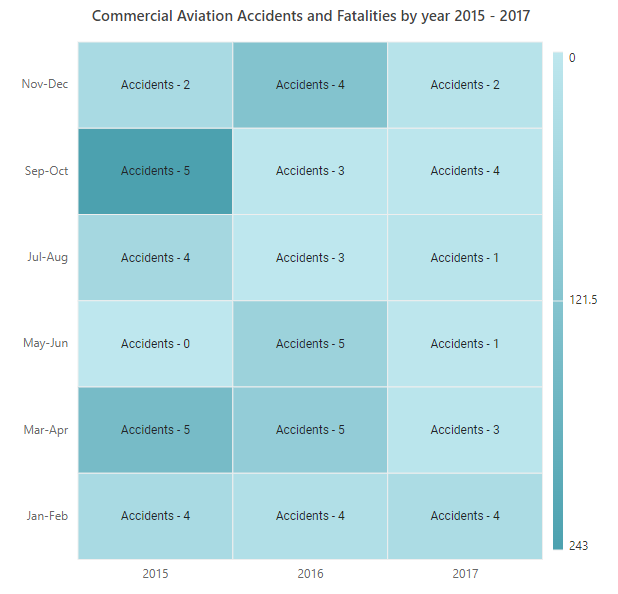
The following example demonstrates how to add a data label template for JSON cell binding.
<ejs-heatmap id='container' showTooltip="true" load="onHeatmapLoad">
  <e-heatmap-titlesettings text="Commercial Aviation Accidents and Fatalities by year 2015 - 2017"
    textStyle="ViewBag.textStyle">
  </e-heatmap-titlesettings>
  <e-heatmap-xaxis labels="ViewBag.xLabels">
  </e-heatmap-xaxis>
  <e-heatmap-yaxis labels="ViewBag.yLabels">
  </e-heatmap-yaxis>
  <e-heatmap-cellsettings labelTemplate="<div> Accidents - ${Accidents}</div>"></e-heatmap-cellsettings>
  <e-heatmap-legendsettings visible="true"></e-heatmap-legendsettings>
  <e-heatmap-datasourcesettings isJsonData="true" adaptorType="Cell" xDataMapping="Year" yDataMapping="Months" valueMapping="Fatalities">
  </e-heatmap-datasourcesettings>
</ejs-heatmap>

<script>
  var dataSource = [
    { Year: '2017', Months: 'Jan-Feb', Accidents: 4, Fatalities: 39 },
    { Year: '2017', Months: 'Mar-Apr', Accidents: 3, Fatalities: 8 },
    { Year: '2017', Months: 'May-Jun', Accidents: 1, Fatalities: 3 },
    { Year: '2017', Months: 'Jul-Aug', Accidents: 1, Fatalities: 10 },
    { Year: '2017', Months: 'Sep-Oct', Accidents: 4, Fatalities: 4 },
    { Year: '2017', Months: 'Nov-Dec', Accidents: 2, Fatalities: 15 },
    { Year: '2016', Months: 'Jan-Feb', Accidents: 4, Fatalities: 28 },
    { Year: '2016', Months: 'Mar-Apr', Accidents: 5, Fatalities: 92 },
    { Year: '2016', Months: 'May-Jun', Accidents: 5, Fatalities: 73 },
    { Year: '2016', Months: 'Jul-Aug', Accidents: 3, Fatalities: 1 },
    { Year: '2016', Months: 'Sep-Oct', Accidents: 3, Fatalities: 4 },
    { Year: '2016', Months: 'Nov-Dec', Accidents: 4, Fatalities: 126 },
    { Year: '2015', Months: 'Jan-Feb', Accidents: 4, Fatalities: 45 },
    { Year: '2015', Months: 'Mar-Apr', Accidents: 5, Fatalities: 152 },
    { Year: '2015', Months: 'May-Jun', Accidents: 0, Fatalities: 0 },
    { Year: '2015', Months: 'Jul-Aug', Accidents: 4, Fatalities: 54 },
    { Year: '2015', Months: 'Sep-Oct', Accidents: 5, Fatalities: 243 },
    { Year: '2015', Months: 'Nov-Dec', Accidents: 2, Fatalities: 45 },
  ];

  window.onHeatmapLoad = function (args) {
    args.heatmap.dataSource = dataSource;
  }

</script>
public ActionResult Gradient()
{
ViewBag.textStyle = new
{
size = "15px",
fontWeight = "500",
fontStyle = "Normal",
fontFamily = "Segoe UI"
};
string[] xlabels = new string[3] { "2015", "2016", "2017" };
ViewBag.xLabels = xlabels;
string[] yLabels = new string[6] { "Jan-Feb", "Mar-Apr", "May-Jun", "Jul-Aug", "Sep-Oct", "Nov-Dec" };
ViewBag.yLabels = yLabels;
return View();
}