Getting Started with Angular Accumulation Chart
This section explains the steps required to create a simple accumulation chart and demonstrates the basic usage of the Angular Accumulation Chart component.
Ready to streamline your Syncfusion® Angular development? Discover the full potential of Syncfusion® Angular components with Syncfusion® AI Coding Assistant. Effortlessly integrate, configure, and enhance your projects with intelligent, context-aware code suggestions, streamlined setups, and real-time insights—all seamlessly integrated into your preferred AI-powered IDEs like VS Code, Cursor, Syncfusion® CodeStudio and more. Explore Syncfusion® AI Coding Assistant
Prerequisites
Before getting started, ensure that your environment meets the system requirements for Syncfusion® Angular UI components, which covers supported Node.js, Angular, and @syncfusion/ej2-angular-charts versions.
Before You Begin
This guide uses the standalone application structure generated by the latest Angular CLI.
The main files used in this guide are:
-
src/app/app.ts— Defines the root standalone component. -
src/index.html— Contains the Angular root element.
Note: In newer Angular CLI standalone projects, the root component may be generated as
src/app/app.ts. In NgModule-based Angular projects, the equivalent file is typicallysrc/app/app.component.ts.
Note: If your application uses an older NgModule-based structure, import
AccumulationChartModulein the application module, such asapp.module.ts, instead of adding it to the standalone componentimportscollection.
Step 1: Install the Angular CLI
Use Angular CLI to create and manage Angular applications. Install Angular CLI globally using the following command:
npm install -g @angular/cliVerify the installation:
ng versionStep 2: Create an Angular application
Create a new Angular application using the following command:
ng new my-accumulation-chart-app-
This command will prompt you to choose stylesheet, SSR/SSG, and AI tool configuration options. For this basic Accumulation Chart sample, you can use the following options:
-
Stylesheet system: Choose any option. This guide uses
CSSfor simplicity and applies the Syncfusion Tailwind 3 theme via CSS imports. -
SSR and SSG/Pre-rendering: Select
No. -
AI tools configuration: Select
None.
Navigate to the project folder:
cd my-accumulation-chart-appOpen the project in Command Prompt, PowerShell, or Terminal before proceeding to the next step.
Step 3: Install the Syncfusion® Angular Accumulation Chart package
All Syncfusion Essential® JS 2 packages are available in the npmjs.com registry. The Angular Chart package can be installed using the following command:
npm install @syncfusion/ej2-angular-chartsNote: Installing
@syncfusion/ej2-angular-chartsautomatically installs the required dependency packages.
Step 4: Register the Accumulation Chart module and add the component
Import AccumulationChartModule from @syncfusion/ej2-angular-charts and add it to the imports collection of the standalone component. Then, add the Angular Accumulation Chart component using the <ejs-accumulationchart> selector in the component template.
Update the src/app/app.ts file as follows:
import { Component } from '@angular/core';
import { AccumulationChartModule } from '@syncfusion/ej2-angular-charts';

@Component({
  selector: 'app-root',
  standalone: true,
  imports: [AccumulationChartModule],
  template: `<ejs-accumulationchart id="pie-container"></ejs-accumulationchart>`
})
export class App {}
This renders an empty accumulation chart in the application’s view.
Note: The component selector must match the root element used in the
src/index.htmlfile. Angular CLI commonly uses<app-root></app-root>, so this example usesselector: 'app-root'.
Run the application with npm start and verify that an empty accumulation chart renders before proceeding to the next step.
Step 5: Create your first Accumulation Chart with data source and series type
This section explains how to create a simple accumulation chart by binding data and rendering a series using the Angular Accumulation Chart component.
The following example demonstrates how to visualize monthly data using a pie chart. It also shows how to bind data, map fields using the dataSource, xName , and yName properties, and configure the legend using the legendSettings property.
Update the src/app/app.ts file as follows:
import { Component, OnInit } from '@angular/core';
import { AccumulationChartModule, PieSeriesService, AccumulationLegendService } from '@syncfusion/ej2-angular-charts';

@Component({
    selector: 'app-root',
    standalone: true,
    imports: [AccumulationChartModule],
    providers: [PieSeriesService, AccumulationLegendService],
    template: `
        <ejs-accumulationchart
            id="pie-container"
            [legendSettings]='legendSettings'
        >
            <e-accumulation-series-collection>
                <e-accumulation-series
                    [dataSource]='piedata'
                    type='Pie'
                    xName='x'
                    yName='y'
                >
                </e-accumulation-series>
            </e-accumulation-series-collection>
        </ejs-accumulationchart>
    `
})
export class App implements OnInit {
    public piedata?: Object[];
    public legendSettings?: Object;
    ngOnInit(): void {
        this.piedata = [
            { x: 'Jan', y: 3 }, { x: 'Feb', y: 3.5 },
            { x: 'Mar', y: 7 }, { x: 'Apr', y: 13.5 },
            { x: 'May', y: 19 }, { x: 'Jun', y: 23.5 },
            { x: 'Jul', y: 26 }, { x: 'Aug', y: 25 },
            { x: 'Sep', y: 21 }, { x: 'Oct', y: 15 },
            { x: 'Nov', y: 9 }, { x: 'Dec', y: 3.5 }
        ];
        this.legendSettings = {
            visible: false
        };
    }
}
import { bootstrapApplication } from '@angular/platform-browser';
import { App } from './app';
import 'zone.js';
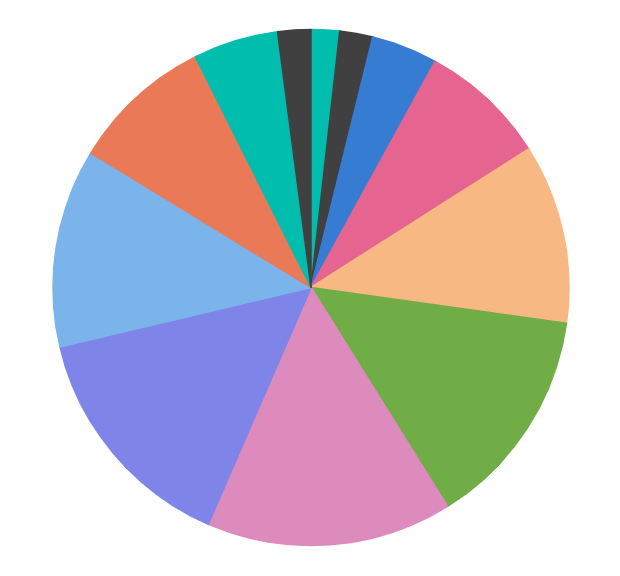
bootstrapApplication(App).catch((err) => console.error(err));The chart renders a pie with one slice for each month (Jan–Dec) sized according to the data values. Hovering over a slice displays a tooltip with the month and value, and each slice can be pulled out individually for emphasis.
The following table summarizes the key properties used in this example:
| Properties | Description |
|---|---|
legendSettings |
Controls the visibility and appearance of the accumulation chart legend. In this sample, the legend is hidden by setting visible: false. |
dataSource |
Provides the JSON data used to render the accumulation chart. |
type |
Specifies the accumulation series type, such as Pie, Pyramid, or Funnel. |
xName |
Maps the category field (for example, x) from the data source. |
yName |
Maps the numeric field (for example, y) from the data source. |
<e-accumulation-series-collection> and <e-accumulation-series>
|
Directives used to define and render an accumulation series in the chart. |
Step 6: Run the application
Run the application using the following command:
npm startOpen the generated local URL (for example, http://localhost:4200/) from the terminal in the browser. The application displays a pie chart showing monthly distribution from January to December, as shown below:
Troubleshooting
If the accumulation chart does not render as expected, check for these common issues:
-
“No provider for PieSeriesService” error: Confirm that
PieSeriesServiceandAccumulationLegendServiceare added to the component’sprovidersarray. Each accumulation series type requires its corresponding service. -
Chart not visible: Verify that the
<ejs-accumulationchart>element has a uniqueidand that the component’sselectormatches the root element used insrc/index.html(commonly<app-root>). -
Data not displayed: Check that the
xNameandyNamevalues match the field names in your data source exactly, and that thedataSourceis assigned before the chart renders. -
Build errors: Run
ng versionto confirm that Node.js, Angular CLI, and@syncfusion/ej2-angular-chartsare on supported versions, and check the terminal output for the specific error. -
Port already in use: If
npm startfails because port4200is in use, runng serve --port 4201(or another free port) instead.
See also
- Legend — Configure the accumulation chart legend.
- Data Label — Customize the data labels displayed on slices.
- Pie, Doughnut, Pyramid, and Funnel Charts — Explore other accumulation chart types.