Getting Started
28 Sep 202314 minutes to read
This section explains briefly about how to create a TreeMap in your application with Aurelia.
Create your first TreeMap in Aurelia
You can configure an Essential Aurelia TreeMap in simple steps. In this section, you can learn how to configure a TreeMap control in a real-time scenario where it is used to visually represent the percentage of growth in population in each continent. It also provides a walk-through on some of the customization features available in TreeMap control.
Add Libraries
To add a TreeMap control in your application, refer the following libraries in an HTML page.
- jQuery version 1.10.1 and above
- JsRender
- ej.web.all
The following code sample explains how to link these libraries from a Content Delivery Network (CDN).
<!--  jquery script  -->
      <script type="text/javascript" src="//cdn.syncfusion.com/js/assets/external/jquery-2.1.4.min.js"></script>
    <!-- Essential JS UI widget -->
      <script src="http://cdn.syncfusion.com/24.2.3/js/ej.widgets.all.min.js"></script>
    <!-- JS Render widget -->
      <script src="http://cdn.jsdelivr.net/jsrender/1.0pre35/jsrender.min.js" type="text/javascript"></script>
    <!-- Essential JS theme  -->
      <script src="http://cdn.syncfusion.com/24.2.3/js/web/flat-azure/ej.web.all.min.css" type="text/javascript"></script>
Initialize TreeMap
Before we start with TreeMap, please refer this page for general information regarding integrating Syncfusion widget’s.
For quick start, we already configured a template project in GitHub repository syncfusion-template-repository. Run the below set of commands to clone the repository and install the required packages for Syncfusion Aurelia application.
> git clone "https://github.com/aurelia-ui-toolkits/syncfusion-template-repository"
    > cd syncfusion-template-repository
    > npm install
    > jspm install
The below steps describes to create Syncfusion Aurelia TreeMap component.
Create TreeMap folder inside src/samples/ location.
Create TreeMap.html file inside src/samples/TreeMap folder and use the below code example to render the TreeMap component.
Create a <div> tag with a specific id and set the height and width to determine the TreeMap size to be rendered.
<template>
     <div>
        <ej-tree-map id="container"></ej-tree-map>
     </div>
</template>
Populate DataSource
The data-source property accepts the collection values as input. For example, you can provide the list of objects as input.
Weight Value Path
You can calculate the size of the object using weight-value-path of TreeMap.
Add a <script> tag anywhere in a web page and initialize TreeMap as illustrated in the following code sample.
<template>
     <div>
        <ej-tree-map id="container"  e-weight-value-path="Population" e-data-source.bind="population_data">

        </ej-tree-map>
     </div>
</template>
Populate the TreeMap data in JSON object. For example, you can use population data of countries to generate TreeMap data as illustrated in the following code sample.
this.population_data = [
                   { Continent: "Asia", Region: "Southern Asia", Growth: 1.32, Population: 1749046000 },
                   { Continent: "Asia", Region: "Eastern Asia", Growth: 0.57, Population: 1620807000 },
                   { Continent: "Asia", Region: "South-Eastern Asia", Growth: 1.20, Population: 618793000 },
                   { Continent: "Asia", Region: "Western Asia", Growth: 1.98, Population: 245707000 },
                   { Continent: "Asia", Region: "Central Asia", Growth: 1.43, Population: 64370000 },
                   { Continent: "Europe", Region: "Europe", Growth: 0.10, Population: 742452000 },
                   { Continent: "America", Region: "South America", Growth: 1.06, Population: 406740000 },
                   { Continent: "America", Region: "Northern America", Growth: 0.85, Population: 355361000 },
                   { Continent: "America", Region: "Central America", Growth: 1.40, Population: 167387000 },
                   { Continent: "Africa", Region: "Eastern Africa", Growth: 2.89, Population: 373202000 },
                   { Continent: "Africa", Region: "Western Africa", Growth: 2.78, Population: 331255000 },
                   { Continent: "Africa", Region: "Northern Africa", Growth: 1.70, Population: 210002000 },
                   { Continent: "Africa", Region: "Middle Africa", Growth: 2.79, Population: 135750000 },
                   { Continent: "Africa", Region: "Southern Africa", Growth: 0.91, Population: 60425000 }
        ];
NOTE
Population data is referred from List of continents by population.
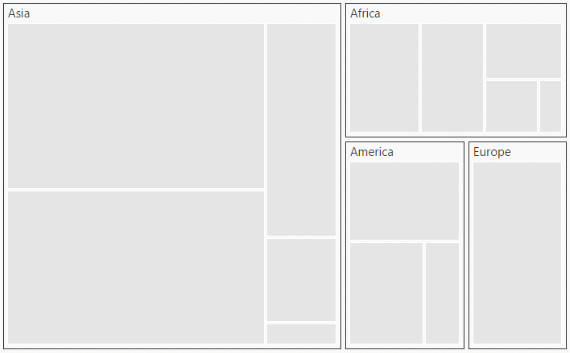
The following screenshot displays a TreeMap control that is rendered after executing the above code sample. The control is rendered with the default properties using the above code.

Group with Levels
You can group TreeMap items using the levels in it.
Group Path
You can use group-path property for every flat level of the TreeMap control. It is a path to a field on the source object that serves as the “Group” for the level specified. You can group the data based on the group-path in the TreeMap control. When the group-path is not specified, then the items are not grouped and the data is displayed in the order specified in the data-source.
Group Gap
You can use group-gap property to separate the items from every flat level and to differentiate the levels mentioned in the TreeMap control.
The following code sample explains how to group TreeMap Items using ‘Levels’.
<template>
     <div>
        <ej-tree-map id="container"  e-weight-value-path="Population" e-data-source.bind="population_data">
	 	    <ej-level e-group-path="Continent" e-group-gap="5"></ej-level>
        </ej-tree-map>
     </div>
</template>
The following screenshot displays grouping of TreeMapItems using Levels.
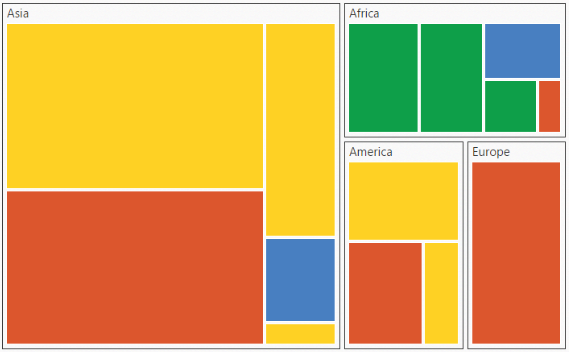
Customize TreeMap by Range
You can differentiate the nodes based on its value and color ranges using Range color. You can also define the color value range using from and to properties.
Color Value Path
The color-value-path of TreeMap is a path to a field on the source object. You can determine the color for the object using color-value-path of TreeMap.
The following code sample explains how to customize TreeMap appearance using Range.
this.rangeColorMapping = [
                    { color: "#DC562D", from: "0", to: "1" },
                    { color: "#FED124", from: "1", to: "1.5" },
                    { color: "#487FC1", from: "1.5", to: "2" },
                    { color: "#0E9F49", from: "2", to: "3" }
];<template>
<div>
<ej-tree-map id="container" e-weight-value-path="Population" e-color-value-path="Growth" e-data-source.bind="population_data" e-range-color-mapping.bind="rangeColorMapping">
<ej-level e-group-path="Continent" e-group-gap="5"></ej-level>
</ej-tree-map>
</div>
</template>The following screenshot displays a customized TreeMap control.
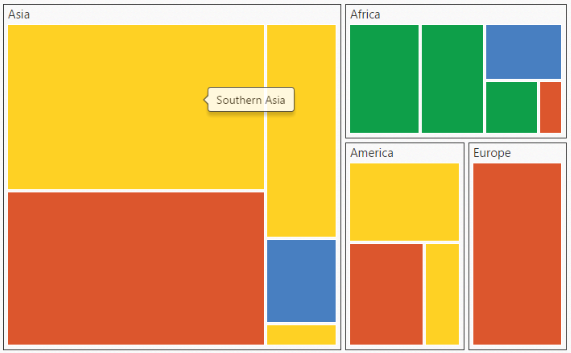
Enable Tooltip
You can enable the tooltip by setting show-tooltip property to “True”. By default, it takes the property of the bound object that is referred in the weight-value-path and displays its content when the corresponding node is hovered. You can customize the template for tooltip using tooltip-template property.
Leaf ItemSettings
You can customize the Leaf level TreeMap items using leaf-item-settings. The Label and tooltip values take the property of bound object that is referred in the label-path when defined. The following code sample displays how the tooltip is enabled.
this.leafItemSettings = {labelPath: 'Region'};<template>
<div>
<ej-tree-map id="container" e-weight-value-path="Population" e-color-value-path="Growth" e-data-source.bind="population_data"
e-show-tooltip="true" e-tooltip-template="template" e-range-color-mapping.bind="rangeColorMapping" e-leaf-item-settings.bind="leafItemSettings" >
<ej-level e-group-path="Continent" e-group-gap="5"></ej-level>
</ej-tree-map>
</div>
</template>
<script id="template" type="application/jsrender">
<div style="margin-left:17px;margin-top:-45px;">
<div style="height:auto;width:auto;background:black;border-radius:3px;opacity:1">
<div style="margin-top:-20px;margin-left:9px;padding-top:3px;margin-right:9px;">
<label style="margin-top:-20px;font-weight:normal;font-size:12px;color:white;font-family:Segoe UI;"></label>
</div>
<div style="height:10px;"></div>
<div style="margin-top:-10px;margin-left:9px;margin-right:9px;padding-bottom:3px;">
<label style="margin-top:-10px;font-weight:normal;font-size:14px;color:white;font-family:segoe ui light;"></label>
</div>
</div>
</div>
</script>The following screenshot displays a ToolTip in a TreeMap control.
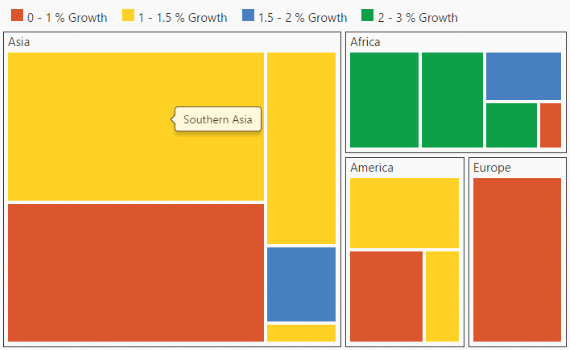
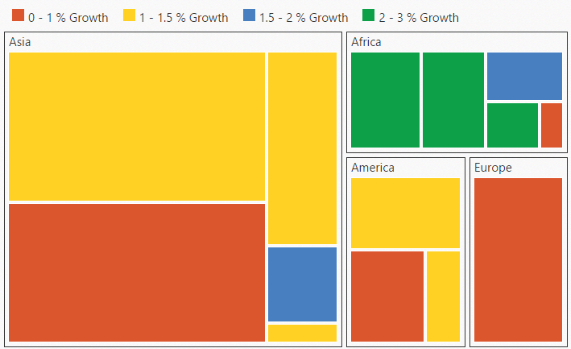
Enable Legend
You can set the color value of leaf nodes using TreeMap Legend. This legend is appropriate only for the TreeMap whose leaf nodes are colored using rangeColorMapping. You can set showLegend property value to “True” to make a legend visible.
Label for Legend
You can customize the labels of the legend item using legendLabel property of rangeColorMapping.
The following code sample illustrates how to add labels for legend in a TreeMap.
this.leafItemSettings = {labelPath: 'Region'};this.legendSettings = { width: 690, height: 38};
this.rangeColorMapping = [
{ color: "#DC562D", from: "0", to: "1", legendLabel: "0 - 1 % Growth" },
{ color: "#FED124", from: "1", to: "1.5", legendLabel: "1 - 1.5 % Growth" },
{ color: "#487FC1", from: "1.5", to: "2", legendLabel: "1.5 - 2 % Growth" },
{ color: "#0E9F49", from: "2", to: "3", legendLabel: "2 - 3 % Growth" }
];
<template>
     <div>
    <ej-tree-map id="container"  e-weight-value-path="Population" e-color-value-path="Growth" e-data-source.bind="population_data"
       e-show-tooltip="true" e-tooltip-template="template" e-range-color-mapping.bind="rangeColorMapping"
       e-leaf-item-settings.bind="leafItemSettings"  e-show-legend="true" e-legend-settings.bind="legendSettings">
	  <ej-level e-group-path="Continent" e-group-gap="5"></ej-level>
   </ej-tree-map>

 </div>
</template>
The following screenshot displays labels in a TreeMap control.
NOTE
Population data is referred from List of continents by population.