Getting Started
31 Jul 20176 minutes to read
Before we start with the ReportViewer, please refer this page page for general information regarding integrating Syncfusion widgets.
For quick start, we already configured a template project in GitHub repository syncfusion-template-repository. Run the below set of commands to clone the repository and install the required packages for Syncfusion Aurelia application.
> git clone "https://github.com/aurelia-ui-toolkits/syncfusion-template-repository"
    > cd syncfusion-template-repository
    > npm install
    > jspm install
Create your first ReportViewer in Aurelia
This section explains briefly about how to create a ReportViewer in your web application with Aurelia.
Control Initialization
The below steps describes to create Syncfusion Aurelia ReportViewer component.
Create `reportviewer` folder inside `src/samples/` location.
1.Create reportviewer.html file inside src/samples/reportviewer folder and use the below code example to render the ReportViewer component.
<template>
    <require from="./reportviewer.css"></require>
    <div>
        <ej-report-viewer id="container" e-report-service-url="http://js.syncfusion.com/ejservices/api/ReportViewer" e-processing-mode="Remote" e-report-path="GroupingAgg.rdl"></ej-report-viewer>
    </div>
</template>
NOTE
Default RDL Report will be rendered, which is used in the online service.You can obtain sample rdl/rdlc files from Syncfusion installed location (%userprofile%\AppData\Local\Syncfusion\EssentialStudio\32.1.19\Common\Data\ejReportTemplate).
2.Create reportviewer.js file inside src/samples/reportviewer folder with below code snippet.
export class RDLSample {

  constructor() {}

}
3.Create reportviewer.css file inside src/samples/reportviewer folder with below code snippet.
ej-report-viewer{
    display: block;
    height: 645px;
}
Run the Application
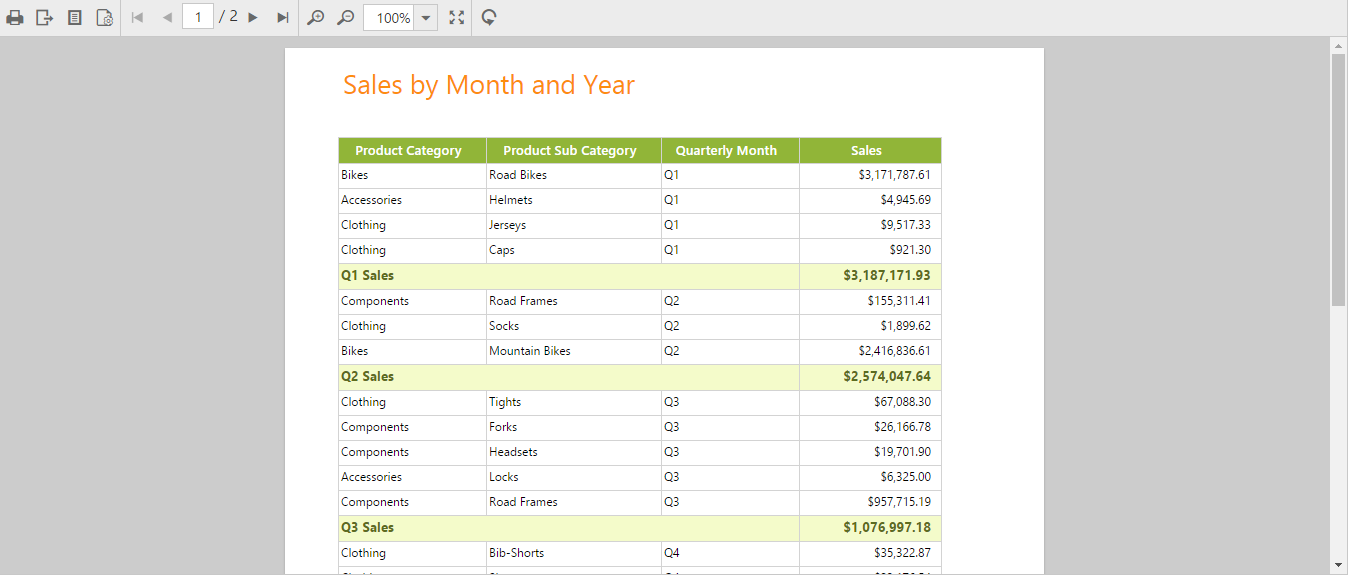
Run the sample application and you can see the ReportViewer on the page as displayed in the following screenshot.

ReportViewer with Grouping Aggregate Report
Load SSRS Server Reports
ReportViewer supports to load RDL/RDLC files from SSRS Server. The following steps help you to load reports from SSRS Server.
1.Create reportviewer.html file inside src/samples/reportviewer folder and Set the reportPath from SSRS and SSRS reportServerUrl in the ReportViewer properties.
<template>
    <require from="./reportviewer.css"></require>
    <div>
        <ej-report-viewer id="container" e-report-service-url="http://js.syncfusion.com/ejservices/api/ReportViewer" e-processing-mode="Remote" e-report-server-url="http://mvc.syncfusion.com/reportserver" e-report-path="/SSRSSamples2/Territory Sales new"></ej-report-viewer>
    </div>
</template>
NOTE
The credential information for Report Server is provided in online service.
2.Create reportviewer.js file inside src/samples/reportviewer folder with below code snippet.
export class TerritorySales {

  constructor() {}

}
3.Create reportviewer.css file inside src/samples/reportviewer folder with below code snippet.
ej-report-viewer{
    display: block;
    height: 645px;
}
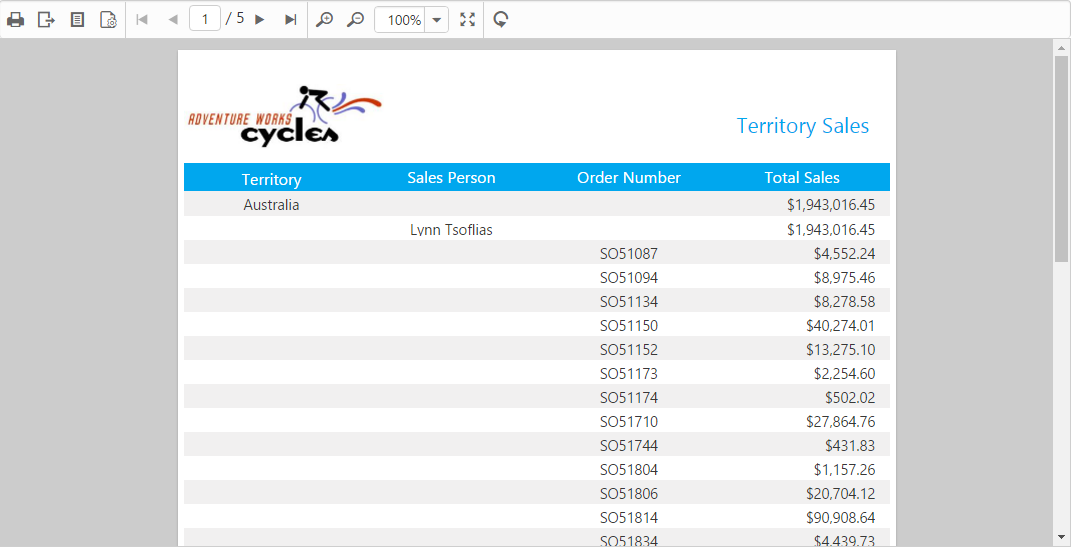
4.Run the application and you can see the ReportViewer on the page as displayed in the following screenshot.

Report from SSRS
Load RDLC Reports
The ReportViewer has data binding support to visualize the RDLC reports. The following code example helps you to bind data to ReportViewer.
1.Create reportviewer.html file inside src/samples/reportviewer folder and assign the RDLC report path to ReportViewer’s reportPath property and specify the processingMode as local in the ReportViewer properties.
<template>
    <require from="./reportviewer.css"></require>
    <div>
        <ej-report-viewer id="container" e-report-service-url="http://js.syncfusion.com/ejservices/api/ReportViewer" e-processing-mode="Local" e-report-path="AreaCharts.rdlc"></ej-report-viewer>
    </div>
</template>
NOTE
Default RDLC Report will be rendered, which is used in the online service. You can obtain sample rdl/rdlc files from Syncfusion installed location (%userprofile%\AppData\Local\Syncfusion\EssentialStudio\32.1.19\Common\Data\ejReportTemplate).
2.Create reportviewer.js file inside src/samples/reportviewer folder with below code snippet.
export class Areachart {
  constructor() {
    this.dataSource = [{
      value: [
        { SalesPersonID: 281, FullName: 'Ito', Title: 'Sales Representative', SalesTerritory: 'South West', Y2002: 0, Y2003: 28000, Y2004: 3018725 },
        { SalesPersonID: 282, FullName: 'Saraiva', Title: 'Sales Representative', SalesTerritory: 'Canada', Y2002: 25000, Y2003: 14000, Y2004: 3189356 },
        { SalesPersonID: 283, FullName: 'Cambell', Title: 'Sales Representative', SalesTerritory: 'North West', Y2002: 12000, Y2003: 13000, Y2004: 1930885 },
        { SalesPersonID: 275, FullName: 'Blythe', Title: 'Sales Representative', SalesTerritory: 'North East', Y2002: 19000, Y2003: 47000, Y2004: 4557045 },
        { SalesPersonID: 276, FullName: 'Mitchell', Title: 'Sales Representative', SalesTerritory: 'South West', Y2002: 28000, Y2003: 46000, Y2004: 5240075 },
        { SalesPersonID: 277, FullName: 'Carson', Title: 'Sales Representative', SalesTerritory: 'Central', Y2002: 33000, Y2003: 49000, Y2004: 3857163 },
        { SalesPersonID: 278, FullName: 'Vargas', Title: 'Sales Representative', SalesTerritory: 'Canada', Y2002: 11000, Y2003: 14000, Y2004: 1764938 },
        { SalesPersonID: 279, FullName: 'Reiter', Title: 'Sales Representative', SalesTerritory: 'South East', Y2002: 32000, Y2003: 26000, Y2004: 2811012 }
      ],
      name: 'AdventureWorksXMLDataSet'
    }];
  }
}
3.Create reportviewer.css file inside src/samples/reportviewer folder with below code snippet.
ej-report-viewer{
    display: block;
    height: 645px;
}
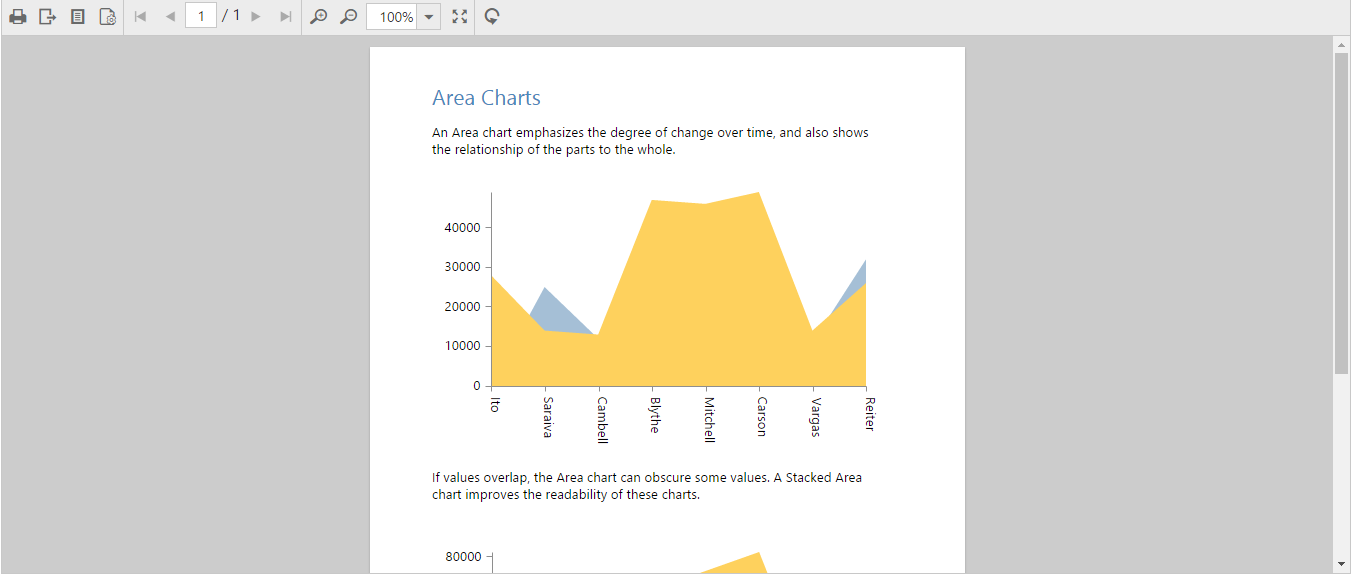
4.Run the application and you can see the ReportViewer on the page as displayed in the following screenshot.

Area Chart RDLC Report