Getting Started
6 Dec 201713 minutes to read
This section explains briefly about how to create a RangeNavigator in your application with Aurelia.
Create your first RangeNavigator in Aurelia
This section encompasses on how to configure the ejRangeNavigator and update the chart control for RangeNavigator’s selected range. It also helps you to learn how to pass the required data to RangeNavigator and customize the scale and selected range for your requirements. In this example, you will look at the steps to configure a RangeNavigator to analyze sales of a product for a particular quarter in a year.

Before we start with RangeNavigator, please refer this page for general information regarding integrating Syncfusion widget’s.
For quick start, we already configured a template project in GitHub repository syncfusion-template-repository. Run the below set of commands to clone the repository and install the required packages for Syncfusion Aurelia application.
> git clone "https://github.com/aurelia-ui-toolkits/syncfusion-template-repository"
    > cd syncfusion-template-repository
    > npm install
    > jspm install
The below steps describes to create Syncfusion Aurelia RangeNavigator component.
Create RangeNavigator folder inside src/samples/ location.
Create RangeNavigator.html file inside src/samples/RangeNavigator folder and use the below code example to render the RangeNavigator component.
Adding script reference
Create an HTML page and add the scripts references in the order mentioned in the following code example.
<!DOCTYPE html>
<html>
<head>
    <!--  jquery script  -->
    <script type="text/javascript" src="//cdn.syncfusion.com/js/assets/external/jquery-2.1.4.min.js"></script>
    <!-- Essential JS UI widget -->
    <script type="text/javascript" src="//cdn.syncfusion.com/14.3.0.49/js/web/ej.web.all.min.js"></script>
</head>
<body>
</body>
</html>
In the above code, ej.web.all.min.js script reference has been added for demonstration purpose. It is not recommended to use this for deployment purpose, as its file size is larger since it contains all the widgets. Instead, you can use CSG utility to generate a custom script file with the required widgets for deployment purpose.
- Add a script tag inside the <Body> tag and add the following code example.
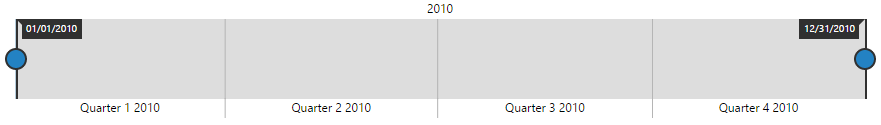
The following code example renders a RangeNavigator with a range from 2010, January 1st to December 31st.
this.rangeSettings = {
             start: "2010/1/1", end: "2010/12/31"
};<template>
<div>
<ej-range-navigator id="navigator"
e-range-settings.bind="rangeSettings">
</ej-range-navigator>
</div>
</template>The following screen shot displays the RangeNavigator with a range from 2010, January 1st to December 31st.
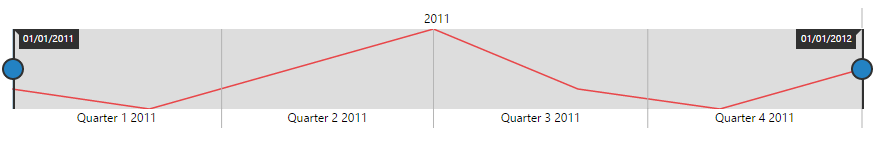
Add series
To add series to RangeNavigator, you need to set dataSource property of RangeNavigator as shown in the following code example.
You can create data source for RangeNavigator as follows.
this.dataSource = [{ "xDate": new Date(2011, 0, 1), "yValue": 10 },
                        { "xDate": new Date(2011, 2, 1), "yValue": 5 },
                        { "xDate": new Date(2011, 4, 1), "yValue": 15 },
                        { "xDate": new Date(2011, 6, 1), "yValue": 25 },
                        { "xDate": new Date(2011, 8, 1), "yValue": 10 },
                        { "xDate": new Date(2011, 10, 1), "yValue": 5 },
                        { "xDate": new Date(2011, 12, 1), "yValue": 15 }];
Now, add the dataSource to the RangeNavigator and provide the field name to get the values from the data-source in x-name and y-name options.
<template>
    <div>
        <ej-range-navigator id="navigator" e-data-source.bind="dataSource" e-x-name="xDate"
                            e-y-name="yValue">
        </ej-range-navigator>
    </div>

</template>
The following screenshot displays a RangeNavigator with the default “Line” series type.
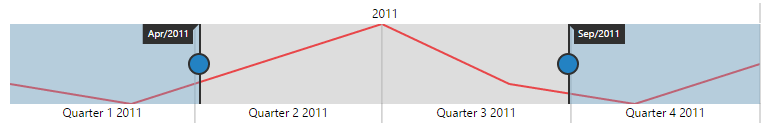
Enable tooltip
You can customize Tooltip for RangeNavigator using tooltip option. You can use tooltipDisplayMode option in tooltip,to display the tooltip “always” or “ondemand” (displays tooltip only while dragging the sliders). You can also specify label format for tooltip using labelFormat.
The following code sample shows how to enable a Tooltip.
this.tooltip =  {
            visible: true, labelFormat: "MMM/yyyy", tooltipDisplayMode: "always",
};<template>
<div>
<ej-range-navigator id="navigator" e-tooltip-settings.bind="tooltip">
</ej-range-navigator>
</div>
</template>The following screenshot displays the label format Tooltip in RangeNavigator:
Update Chart
You can use RangeNavigator with controls such as chart and grid to view the range of data selected in RangeNavigator.
In order to update chart, whenever the selected range changes in RangeNavigator, you need to use rangeChanged event of ejRangeNavigator and then update the chart with the selected data in this event.
You can create a chart with line series using the following code sample.
- Create a <div> tag with an id.
<template>
    <div>
        <ej-chart id="chartContent">
        </ej-chart>
    </div>
</template>- Add a script tag inside the body tag and add the following code sample.
this.dataSource = [{ "xDate": new Date(2011, 0, 1), "yValue": 10 },
                        { "xDate": new Date(2011, 2, 1), "yValue": 5 },
                        { "xDate": new Date(2011, 4, 1), "yValue": 15 },
                        { "xDate": new Date(2011, 6, 1), "yValue": 25 },
                        { "xDate": new Date(2011, 8, 1), "yValue": 10 },
                        { "xDate": new Date(2011, 10, 1), "yValue": 5 },
                        { "xDate": new Date(2011, 12, 1), "yValue": 15 }];
	    this.tooltip =  {
            visible: true, labelFormat: "MMM/yyyy", tooltipDisplayMode: "always",
          };
		  this.title = {
	         //Add chart title
             text: 'Sales Analysis'
	       };
		   this.legend = {
	           //Enable chart legend
	           visible: true,
			   position: 'top'
};<template>
<div>
<ej-chart id="chartContent" e-title.bind="title" e-legend.bind="legend" e-size.bind="size">
<ej-series e-type="line" e-name="Product A" e-x-name="xDate"
e-y-name="yValue" e-data-source.bind="dataSource">
</ej-series>
</ej-chart>
</div>
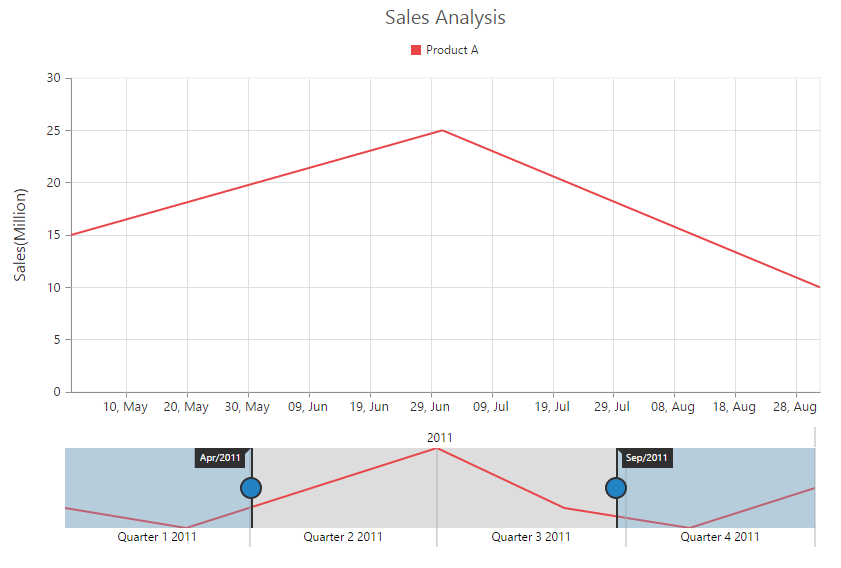
</template>You can update the chart with the selected data using the on-range-changed event of RangeNavigator.
<template>
    <div>
        <ej-range-navigator id="navigator" e-size-settings.bind="sizeSettings" e-data-source.bind="dataSource" e-x-name="xDate"
                            e-y-name="yValue" e-tooltip-settings.bind="tooltip" e-on-range-changed.trigger="onChartLoaded($event)">
        </ej-range-navigator>
</div>onChartLoaded(sender) {
let chartObj = $('#chartContent').data('ejChart');
if (chartObj) {
chartObj.model.primaryXAxis.zoomPosition = sender.detail.zoomPosition;
chartObj.model.primaryXAxis.zoomFactor = sender.detail.zoomFactor;
$('#chartContent').ejChart('redraw');
}
}The following screenshot displays how a RangeNavigator is updated when a selected range is changed.
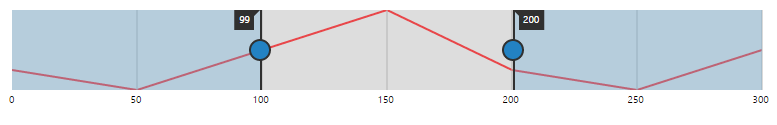
Set value type
RangeNavigator can also be used with numerical values. You can specify the data type using value-type option.
You can create a data-source for Chart Series with integer Values using the following code sample.
this.dataSource = [
    { "xDate": 0, "yValue": 10 },
    { "xDate": 50, "yValue": 5 },
    { "xDate": 100, "yValue": 15 },
    { "xDate": 150, "yValue": 25 },
    { "xDate": 200, "yValue": 10 },
    { "xDate": 250, "yValue": 5 },
    { "xDate": 300, "yValue": 15 },
    ];
Now, you can set the data-source for Chart Series and value-type property to “numeric” as given in the following code example.
<template>
    <div>
        <ej-range-navigator id="navigator" e-size-settings.bind="sizeSettings" e-data-source.bind="dataSource" e-x-name="xDate"
                            e-y-name="yValue" e-value-type="numeric">
        </ej-range-navigator>
    </div>
</template>
The following screenshot displays a RangeNavigator with numerical values: