Getting Started
1 Nov 20168 minutes to read
Before we start with the PivotGrid, please refer this page page for general information regarding integrating Syncfusion widgets.
For quick start, we already configured a template project in GitHub repository syncfusion-template-repository. Run the below set of commands to clone the repository and install the required packages for Syncfusion Aurelia application.
> git clone "https://github.com/aurelia-ui-toolkits/syncfusion-template-repository"
    > cd syncfusion-template-repository
    > npm install
    > jspm install
Relational
This section covers the information that you need to know to populate a simple PivotGrid with Relational data source.
Control Initialization
The below steps describe to create Syncfusion Aurelia PivotGrid component.
Create `pivotgrid` folder inside `src/samples/` location.
Create `pivotgrid.html` file inside `src/samples/pivotgrid` folder and use the below code example to render the PivotGrid component.
<template>
  <require from="./pivotgrid.css"></require>
  <div>
    <ej-pivot-grid id="PivotGrid1"></ej-pivot-grid>
  </div>
</template>- Create
pivotgrid.jsfile insidesrc/samples/pivotgridfolder with below code snippet.
export class BasicUse {

  constructor() {}

}- Create
pivotgrid.cssfile insidesrc/samples/pivotgridfolder with below code snippet.
ej-pivot-grid {
    display: block;
    height: 350px;
    width: 95%;
    overflow: auto;
    float:left;
    position: relative !important;
}
Populate PivotGrid with Data
Let us now see how to populate the PivotGrid control using a sample JSON data as shown below.
<template>
  <require from="./pivotgrid.css"></require>
  <div>
    <ej-pivot-tree-map id="PivotGrid1" e-data-source.bind="pivotData"></ej-pivot-tree-map>
  </div>
</template>export class BasicUse {
constructor() {
this.pivotData = {
data: [{ Amount: 100, Country: 'Canada', Date: 'FY 2005', Product: 'Bike', Quantity: 2, State: 'Alberta' },
{ Amount: 200, Country: 'Canada', Date: 'FY 2006', Product: 'Van', Quantity: 3, State: 'British Columbia' },
{ Amount: 300, Country: 'Canada', Date: 'FY 2007', Product: 'Car', Quantity: 4, State: 'Brunswick' },
{ Amount: 150, Country: 'Canada', Date: 'FY 2008', Product: 'Bike', Quantity: 3, State: 'Manitoba' },
{ Amount: 200, Country: 'Canada', Date: 'FY 2006', Product: 'Car', Quantity: 4, State: 'Ontario' },
{ Amount: 100, Country: 'Canada', Date: 'FY 2007', Product: 'Van', Quantity: 1, State: 'Quebec' },
{ Amount: 200, Country: 'France', Date: 'FY 2005', Product: 'Bike', Quantity: 2, State: 'Charente-Maritime' },
{ Amount: 250, Country: 'France', Date: 'FY 2006', Product: 'Van', Quantity: 4, State: 'Essonne' },
{ Amount: 300, Country: 'France', Date: 'FY 2007', Product: 'Car', Quantity: 3, State: 'Garonne (Haute)' },
{ Amount: 150, Country: 'France', Date: 'FY 2008', Product: 'Van', Quantity: 2, State: 'Gers' },
{ Amount: 200, Country: 'Germany', Date: 'FY 2006', Product: 'Van', Quantity: 3, State: 'Bayern' },
{ Amount: 250, Country: 'Germany', Date: 'FY 2007', Product: 'Car', Quantity: 3, State: 'Brandenburg' },
{ Amount: 150, Country: 'Germany', Date: 'FY 2008', Product: 'Car', Quantity: 4, State: 'Hamburg' },
{ Amount: 200, Country: 'Germany', Date: 'FY 2008', Product: 'Bike', Quantity: 4, State: 'Hessen' },
{ Amount: 150, Country: 'Germany', Date: 'FY 2007', Product: 'Van', Quantity: 3, State: 'Nordrhein-Westfalen' },
{ Amount: 100, Country: 'Germany', Date: 'FY 2005', Product: 'Bike', Quantity: 2, State: 'Saarland' },
{ Amount: 150, Country: 'United Kingdom', Date: 'FY 2008', Product: 'Bike', Quantity: 5, State: 'England' },
{ Amount: 250, Country: 'United States', Date: 'FY 2007', Product: 'Car', Quantity: 4, State: 'Alabama' },
{ Amount: 200, Country: 'United States', Date: 'FY 2005', Product: 'Van', Quantity: 4, State: 'California' },
{ Amount: 100, Country: 'United States', Date: 'FY 2006', Product: 'Bike', Quantity: 2, State: 'Colorado' },
{ Amount: 150, Country: 'United States', Date: 'FY 2008', Product: 'Car', Quantity: 3, State: 'New Mexico' },
{ Amount: 200, Country: 'United States', Date: 'FY 2005', Product: 'Bike', Quantity: 4, State: 'New York' },
{ Amount: 250, Country: 'United States', Date: 'FY 2008', Product: 'Car', Quantity: 3, State: 'North Carolina' },
{ Amount: 300, Country: 'United States', Date: 'FY 2007', Product: 'Van', Quantity: 4, State: 'South Carolina' }
],
rows: [
{
fieldName: 'Country',
fieldCaption: 'Country'
}
],
columns: [
{
fieldName: 'Product',
fieldCaption: 'Product'
}
],
values: [
{
fieldName: 'Amount',
fieldCaption: 'Amount'
}
]
};
}
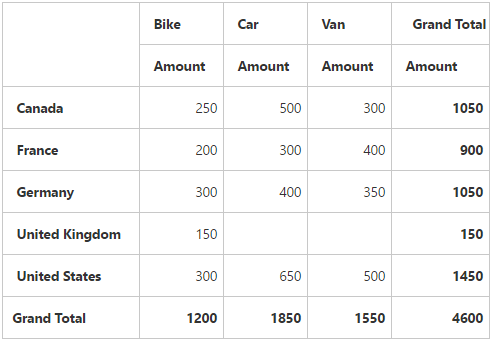
}The above code will generate a simple PivotGrid with “Country” field in Row, “Product” field in Column and “Amount” field in Value section.
OLAP
This section covers the information that you need to know to populate a simple PivotGrid with OLAP data source.
Control Initialization
The below steps describes to create Syncfusion Aurelia PivotGrid component.
Create `pivotgrid` folder inside `src/samples/` location.
Create `pivotgrid.html` file inside `src/samples/pivotgrid` folder and use the below code example to render the PivotGrid component.
<template>
  <require from="./pivotgrid.css"></require>
  <div>
    <ej-pivot-tree-map id="PivotGrid1"></ej-pivot-tree-map>
  </div>
</template>- Create
pivotgrid.jsfile insidesrc/samples/pivotgridfolder with below code snippet.
export class BasicUse {

  constructor() {}

}- Create
pivotgrid.cssfile insidesrc/samples/pivotgridfolder with below code snippet.
ej-pivot-grid {
    display: block;
    height: 350px;
    width: 95%;
    overflow: auto;
    float:left;
    position: relative !important;
}
Populate PivotGrid with Data
Let us now see how to populate the PivotGrid control using a sample JSON data as shown below.
<template>
  <require from="./pivotgrid.css"></require>
  <div>
    <ej-pivot-tree-map id="PivotGrid1" e-data-source.bind="pivotData"></ej-pivot-tree-map>
  </div>
</template>export class BasicUse {
constructor() {
this.pivotData = {
data: 'http://bi.syncfusion.com/olap/msmdpump.dll', //data
catalog: 'Adventure Works DW 2008 SE',
cube: 'Adventure Works',
rows: [
{
fieldName: '[Date].[Fiscal]'
}
],
columns: [
{
fieldName: '[Customer].[Customer Geography]'
}
],
values: [
{
measures: [
{
fieldName: '[Measures].[Internet Sales Amount]'
}
],
axis: 'columns'
}
]
};
}
}The above code will generate a simple PivotGrid with “Fiscal” hierarchy in Row, “Customer Geography” hierarchy in Column and “Internet Sales Amount” measure in Value section.
