Getting Started
1 Nov 201620 minutes to read
Before we start with the PivotGauge, please refer this page page for general information regarding integrating Syncfusion widgets.
For quick start, we already configured a template project in GitHub repository syncfusion-template-repository. Run the below set of commands to clone the repository and install the required packages for Syncfusion Aurelia application.
> git clone "https://github.com/aurelia-ui-toolkits/syncfusion-template-repository"
    > cd syncfusion-template-repository
    > npm install
    > jspm install
Relational
This section covers the information that you need to know to populate a simple PivotGauge with Relational data source.
Control Initialization
The below steps describes to create Syncfusion Aurelia PivotGauge component.
Create `pivotgauge` folder inside `src/samples/` location.
Create `pivotgauge.html` file inside `src/samples/pivotgauge` folder and use the below code example to render the PivotGauge component.
<template>
  <require from="./pivotgauge.css"></require>
  <div>
    <ej-pivot-gauge id="PivotGauge1"></ej-pivot-gauge>
  </div>
</template>- Create
pivotgauge.jsfile insidesrc/samples/pivotgaugefolder with below code snippet.
export class BasicUse {

  constructor() {}

}- Create
pivotgauge.cssfile insidesrc/samples/pivotgaugefolder with below code snippet.
ej-pivot-gauge {
    min-height: 275px;
    height: 338px;
    width: 100%;
    overflow: auto;
    position:relative !important;
}
Populate PivotGauge with data
Let us now see how to populate the PivotGauge control using a sample JSON data as shown below.
<template>
  <require from="./pivotgauge.css"></require>
  <div>
    <ej-pivot-gauge id="PivotGauge1" e-data-source.bind="pivotData" e-enable-tooltip="true" e-rows-count.bind="rowsCount" e-columns-count.bind="columnsCount"
    e-scales.bind="scales" e-load.bind="loadGaugeTheme" e-background-color="transparent">
    </ej-pivot-gauge>
  </div>
</template>export class BasicUse {
constructor() {
this.pivotData = {
data: [{ Amount: 100, Country: 'Canada', Date: 'FY 2005', Product: 'Bike', Quantity: 2, State: 'Alberta' },
{ Amount: 200, Country: 'Canada', Date: 'FY 2006', Product: 'Van', Quantity: 3, State: 'British Columbia' },
{ Amount: 300, Country: 'Canada', Date: 'FY 2007', Product: 'Car', Quantity: 4, State: 'Brunswick' },
{ Amount: 150, Country: 'Canada', Date: 'FY 2008', Product: 'Bike', Quantity: 3, State: 'Manitoba' },
{ Amount: 200, Country: 'Canada', Date: 'FY 2006', Product: 'Car', Quantity: 4, State: 'Ontario' },
{ Amount: 100, Country: 'Canada', Date: 'FY 2007', Product: 'Van', Quantity: 1, State: 'Quebec' },
{ Amount: 200, Country: 'France', Date: 'FY 2005', Product: 'Bike', Quantity: 2, State: 'Charente-Maritime' },
{ Amount: 250, Country: 'France', Date: 'FY 2006', Product: 'Van', Quantity: 4, State: 'Essonne' },
{ Amount: 300, Country: 'France', Date: 'FY 2007', Product: 'Car', Quantity: 3, State: 'Garonne (Haute)' },
{ Amount: 150, Country: 'France', Date: 'FY 2008', Product: 'Van', Quantity: 2, State: 'Gers' },
{ Amount: 200, Country: 'Germany', Date: 'FY 2006', Product: 'Van', Quantity: 3, State: 'Bayern' },
{ Amount: 250, Country: 'Germany', Date: 'FY 2007', Product: 'Car', Quantity: 3, State: 'Brandenburg' },
{ Amount: 150, Country: 'Germany', Date: 'FY 2008', Product: 'Car', Quantity: 4, State: 'Hamburg' },
{ Amount: 200, Country: 'Germany', Date: 'FY 2008', Product: 'Bike', Quantity: 4, State: 'Hessen' },
{ Amount: 150, Country: 'Germany', Date: 'FY 2007', Product: 'Van', Quantity: 3, State: 'Nordrhein-Westfalen' },
{ Amount: 100, Country: 'Germany', Date: 'FY 2005', Product: 'Bike', Quantity: 2, State: 'Saarland' },
{ Amount: 150, Country: 'United Kingdom', Date: 'FY 2008', Product: 'Bike', Quantity: 5, State: 'England' },
{ Amount: 250, Country: 'United States', Date: 'FY 2007', Product: 'Car', Quantity: 4, State: 'Alabama' },
{ Amount: 200, Country: 'United States', Date: 'FY 2005', Product: 'Van', Quantity: 4, State: 'California' },
{ Amount: 100, Country: 'United States', Date: 'FY 2006', Product: 'Bike', Quantity: 2, State: 'Colorado' },
{ Amount: 150, Country: 'United States', Date: 'FY 2008', Product: 'Car', Quantity: 3, State: 'New Mexico' },
{ Amount: 200, Country: 'United States', Date: 'FY 2005', Product: 'Bike', Quantity: 4, State: 'New York' },
{ Amount: 250, Country: 'United States', Date: 'FY 2008', Product: 'Car', Quantity: 3, State: 'North Carolina' },
{ Amount: 300, Country: 'United States', Date: 'FY 2007', Product: 'Van', Quantity: 4, State: 'South Carolina' }
],
rows: [
{
fieldName: 'Country',
fieldCaption: 'Country'
},
{
fieldName: 'State',
fieldCaption: 'State'
}
],
columns: [
{
fieldName: 'Product',
fieldCaption: 'Product'
}
],
values: [
{
fieldName: 'Amount',
fieldCaption: 'Amount'
},
{
fieldName: 'Quantity',
fieldCaption: 'Quantity'
}
]
};
this.rowsCount = 2;
this.columnsCount = 3;
this.backgroundColor = 'transparent';
this.loadGaugeTheme = 'loadGaugeTheme';
this.scales = [{
showRanges: true,
radius: 150, showScaleBar: true, size: 1,
border: {
width: 0.5
},
showIndicators: true, showLabels: true,
pointers: [{
showBackNeedle: true,
backNeedleLength: 20,
length: 125,
width: 7
},
{
type: 'marker',
markerType: 'diamond',
distanceFromScale: 5,
placement: 'center',
backgroundColor: '#29A4D9',
length: 25,
width: 15
}],
ticks: [{
type: 'major',
distanceFromScale: 2,
height: 16,
width: 1, color: '#8c8c8c'
}, {
type: 'minor',
height: 6,
width: 1,
distanceFromScale: 2,
color: '#8c8c8c'
}],
labels: [{
color: '#8c8c8c'
}],
ranges: [{
distanceFromScale: -5,
backgroundColor: '#fc0606',
border: {
color: '#fc0606'
}
}, {
distanceFromScale: -5
}],
customLabels: [{
position: { x: 180, y: 290 },
font: { size: '10px', fontFamily: 'Segoe UI', fontStyle: 'Normal' }, color: '#666666'
}, {
position: { x: 180, y: 320 },
font: { size: '10px', fontFamily: 'Segoe UI', fontStyle: 'Normal' }, lcolor: '#666666'
}, {
position: { x: 180, y: 150 },
font: { size: '12px', fontFamily: 'Segoe UI', fontStyle: 'Normal' }, color: '#666666'
}]
}];
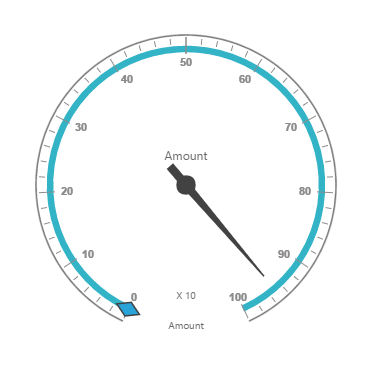
}
}The above code will generate a simple PivotGauge as shown in below figure.
OLAP
This section covers the information that you need to know to populate a simple PivotGauge with OLAP data source.
Control Initialization
The below steps describes to create Syncfusion Aurelia PivotGauge component.
Create `pivotgauge` folder inside `src/samples/` location.
Create `pivotgauge.html` file inside `src/samples/pivotgauge` folder and use the below code example to render the PivotGauge component.
<template>
  <require from="./pivotgauge.css"></require>
  <div>
    <ej-pivot-gauge id="PivotGauge1"></ej-pivot-gauge>
  </div>
</template>- Create
pivotgauge.jsfile insidesrc/samples/pivotgaugefolder with below code snippet.
export class BasicUse {

  constructor() {}

}- Create
pivotgauge.cssfile insidesrc/samples/pivotgaugefolder with below code snippet.
ej-pivot-gauge {
    min-height: 275px;
    height: 338px;
    width: 100%;
    overflow: auto;
    position:relative !important;
}
Populate PivotGauge with data
Let us now see how to populate the PivotGauge control using a sample JSON data as shown below.
<template>
  <require from="./pivotgauge.css"></require>
  <div>
   <ej-pivot-gauge id="PivotGauge1" e-data-source.bind="pivotData" e-enable-tooltip="true" e-rows-count.bind="rowsCount" e-columns-count.bind="columnsCount"
    e-scales.bind="scales" e-load.bind="loadGaugeTheme" e-background-color="transparent">
    </ej-pivot-gauge>
  </div>
</template>import {Component, ViewEncapsulation} from '@angular/core';
@Component({
selector: 'sd-home',
templateUrl: 'app/components/pivotgauge/pivotgauge.component.html', //give the path file for pivotgauge component html file.
styleUrls: ['app/components/pivotgauge/pivotgauge.component.css'], //give the path file for pivotgauge component css file.
})
export class PivotGaugeComponent {
public data; cube; catalog; rows; columns;values;scales;
constructor() {
this.data = "http://bi.syncfusion.com/olap/msmdpump.dll";
this.cube = "Adventure Works";
this.catalog = "Adventure Works DW 2008 SE";
this.rows = [{ fieldName: "[Date].[Fiscal]", filterItems: { filterType: "include", values: ["[Date].[Fiscal].[Fiscal Year].&[2004]"] } }];
this.columns = [{ fieldName: "[Customer].[Customer Geography]" }];
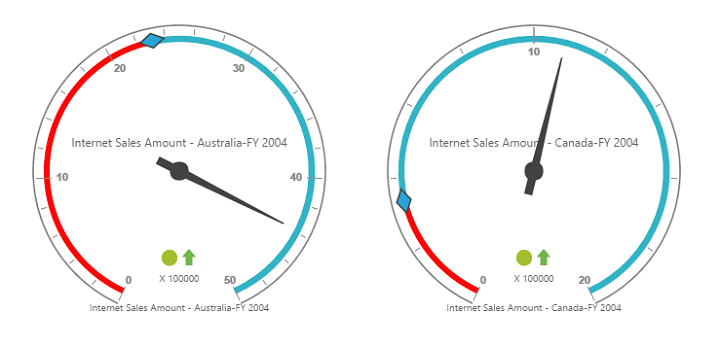
this.values = [{ measures: [{ fieldName: "[Measures].[Internet Sales Amount]", }, { fieldName: "[Measures].[Internet Revenue Status]" }, { fieldName: "[Measures].[Internet Revenue Trend]" }, { fieldName: "[Measures].[Internet Revenue Goal]" },], axis: "columns" }];
this.scales = [{
showRanges: true,
radius: 150, showScaleBar: true, size: 1,
border: {
width: 0.5
},
showIndicators: true, showLabels: true,
pointers: [{
showBackNeedle: true,
backNeedleLength: 20,
length: 120,
width: 7
},
{
type: "marker",
markerType: "diamond",
distanceFromScale: 5,
placement: "center",
backgroundColor: "#29A4D9",
length: 25,
width: 15
}],
ticks: [{
type: "major",
distanceFromScale: 2,
height: 16,
width: 1, color: "#8c8c8c"
},
{
type: "minor",
height: 6,
width: 1,
distanceFromScale: 2,
color: "#8c8c8c"
}],
labels: [{
color: "#8c8c8c"
}],
ranges: [{
distanceFromScale: -5,
backgroundColor: "#fc0606",
border: { color: "#fc0606" }
}, {
distanceFromScale: -5
}],
customLabels: [{
position: { x: 180, y: 290 },
font: { size: "10px", fontFamily: "Segoe UI", fontStyle: "Normal" }, color: "#666666"
}, {
position: { x: 180, y: 320 },
font: { size: "10px", fontFamily: "Segoe UI", fontStyle: "Normal" }, color: "#666666"
}, {
position: { x: 180, y: 150 },
font: { size: "12px", fontFamily: "Segoe UI", fontStyle: "Normal" }, color: "#666666"
}]
}];
}
}The above code will generate a simple PivotGauge as shown in below figure.