Getting Started
1 Nov 20169 minutes to read
Before we start with the PivotChart, please refer this page page for general information regarding integrating Syncfusion widgets.
For quick start, we already configured a template project in GitHub repository syncfusion-template-repository. Run the below set of commands to clone the repository and install the required packages for Syncfusion Aurelia application.
> git clone "https://github.com/aurelia-ui-toolkits/syncfusion-template-repository"
    > cd syncfusion-template-repository
    > npm install
    > jspm install
Relational
This section covers the information that you need to know to populate a simple PivotChart with Relational data source.
Control Initialization
The below steps describes to create Syncfusion Aurelia PivotChart component.
Create `pivotchart` folder inside `src/samples/` location.
Create `pivotchart.html` file inside `src/samples/pivotchart` folder and use the below code example to render the PivotChart component.
<template>
  <require from="./pivotchart.css"></require>
  <div>
    <ej-pivot-chart id="PivotChart1"></ej-pivot-chart>
  </div>
</template>- Create
pivotchart.jsfile insidesrc/samples/pivotchartfolder with below code snippet.
export class BasicUse {

  constructor() {}

}- Create
pivotchart.cssfile insidesrc/samples/pivotchartfolder with below code snippet.
ej-pivot-chart {
    display: block;
    height: 460px;
}
Populate PivotChart with Data
Let us now see how to populate the PivotChart control using a sample JSON data as shown below.
<template>
  <require from="./pivotchart.css"></require>
  <div>
    <ej-pivot-chart id="PivotChart1" e-data-source.bind="pivotData" e-load.bind="loadTheme" e-common-series-options.bind="commonSeries" e-legend.bind="legend"
      e-size.bind="size" e-primary-y-axis.bind="primaryYAxis">
    </ej-pivot-chart>
  </div>
</template>export class BasicUse {
constructor() {
this.pivotData = {
data: [{ Amount: 100, Country: 'Canada', Date: 'FY 2005', Product: 'Bike', Quantity: 2, State: 'Alberta' },
{ Amount: 200, Country: 'Canada', Date: 'FY 2006', Product: 'Van', Quantity: 3, State: 'British Columbia' },
{ Amount: 300, Country: 'Canada', Date: 'FY 2007', Product: 'Car', Quantity: 4, State: 'Brunswick' },
{ Amount: 150, Country: 'Canada', Date: 'FY 2008', Product: 'Bike', Quantity: 3, State: 'Manitoba' },
{ Amount: 200, Country: 'Canada', Date: 'FY 2006', Product: 'Car', Quantity: 4, State: 'Ontario' },
{ Amount: 100, Country: 'Canada', Date: 'FY 2007', Product: 'Van', Quantity: 1, State: 'Quebec' },
{ Amount: 200, Country: 'France', Date: 'FY 2005', Product: 'Bike', Quantity: 2, State: 'Charente-Maritime' },
{ Amount: 250, Country: 'France', Date: 'FY 2006', Product: 'Van', Quantity: 4, State: 'Essonne' },
{ Amount: 300, Country: 'France', Date: 'FY 2007', Product: 'Car', Quantity: 3, State: 'Garonne (Haute)' },
{ Amount: 150, Country: 'France', Date: 'FY 2008', Product: 'Van', Quantity: 2, State: 'Gers' },
{ Amount: 200, Country: 'Germany', Date: 'FY 2006', Product: 'Van', Quantity: 3, State: 'Bayern' },
{ Amount: 250, Country: 'Germany', Date: 'FY 2007', Product: 'Car', Quantity: 3, State: 'Brandenburg' },
{ Amount: 150, Country: 'Germany', Date: 'FY 2008', Product: 'Car', Quantity: 4, State: 'Hamburg' },
{ Amount: 200, Country: 'Germany', Date: 'FY 2008', Product: 'Bike', Quantity: 4, State: 'Hessen' },
{ Amount: 150, Country: 'Germany', Date: 'FY 2007', Product: 'Van', Quantity: 3, State: 'Nordrhein-Westfalen' },
{ Amount: 100, Country: 'Germany', Date: 'FY 2005', Product: 'Bike', Quantity: 2, State: 'Saarland' },
{ Amount: 150, Country: 'United Kingdom', Date: 'FY 2008', Product: 'Bike', Quantity: 5, State: 'England' },
{ Amount: 250, Country: 'United States', Date: 'FY 2007', Product: 'Car', Quantity: 4, State: 'Alabama' },
{ Amount: 200, Country: 'United States', Date: 'FY 2005', Product: 'Van', Quantity: 4, State: 'California' },
{ Amount: 100, Country: 'United States', Date: 'FY 2006', Product: 'Bike', Quantity: 2, State: 'Colorado' },
{ Amount: 150, Country: 'United States', Date: 'FY 2008', Product: 'Car', Quantity: 3, State: 'New Mexico' },
{ Amount: 200, Country: 'United States', Date: 'FY 2005', Product: 'Bike', Quantity: 4, State: 'New York' },
{ Amount: 250, Country: 'United States', Date: 'FY 2008', Product: 'Car', Quantity: 3, State: 'North Carolina' },
{ Amount: 300, Country: 'United States', Date: 'FY 2007', Product: 'Van', Quantity: 4, State: 'South Carolina' }
],
rows: [
{
fieldName: 'Country',
fieldCaption: 'Country'
},
{
fieldName: 'State',
fieldCaption: 'State'
},
{
fieldName: 'Date',
fieldCaption: 'Date'
}
],
columns: [
{
fieldName: 'Product',
fieldCaption: 'Product'
}
],
values: [
{
fieldName: 'Amount',
fieldCaption: 'Amount'
}
]
};
this.primaryYAxis = {title: {text: 'Amount'}};
this.size = {height: '460px', width: '950px'};
this.legend = {visible: true};
this.loadTheme = 'laodTheme';
this.commonSeries = {
enableAnimation: true,
type: 'column'
};
}
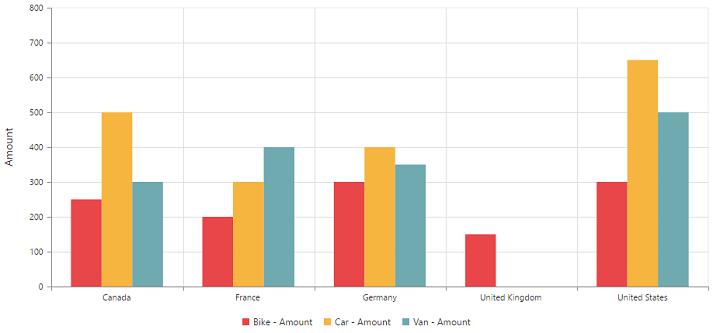
}The above code will generate a simple PivotChart with sales amount over products in different regions.
OLAP
This section covers the information that you need to know to populate a simple PivotChart with OLAP data source.
Control Initialization
The below steps describes to create Syncfusion Aurelia PivotChart component.
Create `pivotchart` folder inside `src/samples/` location.
Create `pivotchart.html` file inside `src/samples/pivotchart` folder and use the below code example to render the PivotChart component.
<template>
  <require from="./pivotchart.css"></require>
  <div>
    <ej-pivot-chart id="PivotChart1"></ej-pivot-chart>
  </div>
</template>- Create
pivotchart.jsfile insidesrc/samples/pivotchartfolder with below code snippet.
export class BasicUse {

  constructor() {}

}- Create
pivotchart.cssfile insidesrc/samples/pivotchartfolder with below code snippet.
ej-pivot-chart {
    display: block;
    height: 460px;
}
Populate PivotChart with Data
Let us now see how to populate the PivotChart control using a sample JSON data as shown below.
<template>
  <require from="./pivotchart.css"></require>
  <div>
    <ej-pivot-chart id="PivotChart1" e-data-source.bind="pivotData" e-load.bind="loadTheme" e-common-series-options.bind="commonSeries" e-legend.bind="legend"
      e-size.bind="size" e-primary-y-axis.bind="primaryYAxis" e-primary-x-axis.bind="primaryXAxis">
    </ej-pivot-chart>
  </div>
</template>export class BasicUse {
constructor() {
this.pivotData = {
data: 'http://bi.syncfusion.com/olap/msmdpump.dll', //data
catalog: 'Adventure Works DW 2008 SE',
cube: 'Adventure Works',
rows: [
{
fieldName: '[Date].[Fiscal]'
}
],
columns: [
{
fieldName: '[Customer].[Customer Geography]'
}
],
values: [
{
measures: [
{
fieldName: '[Measures].[Internet Sales Amount]'
}
],
axis: 'columns'
}
]
};
this.commonSeries = {
enableAnimation: true,
type: 'column'
};
this.loadTheme = 'loadTheme';
this.primaryYAxis = {title: {text: 'Internet Sales Amount'}};
this.size = {height: '460px', width: '950px'};
this.legend = {visible: true, rowCount: 2 };
}
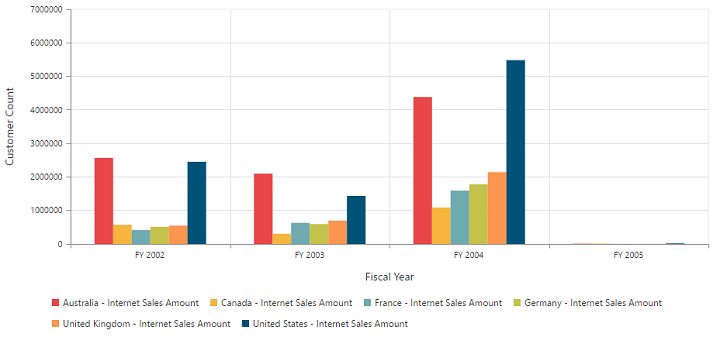
}The above code will generate a simple PivotChart with internet sales amount over a period of fiscal years across different customer geographic locations.