Interval in Flutter Range Selector (SfRangeSelector)
18 Nov 201824 minutes to read
This section explains how to set intervals for numeric and date range selectors.
Numeric interval
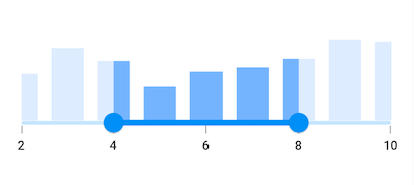
Flutter Range Selector elements like labels, ticks, and dividers are rendered based on the interval, min and max properties. The default value of the interval property is null, and it must be greater than 0.
For example, if min is 2.0 and max is 10.0 and interval is 2.0, the Flutter Range Selector will render the labels, major ticks, and dividers at 2.0, 4.0, and so on.
import 'package:flutter/material.dart';
import 'package:syncfusion_flutter_charts/charts.dart';
import 'package:syncfusion_flutter_sliders/sliders.dart';

class Data {
  Data({required this.x, required this.y});
  final double x;
  final double y;
}

class NumericIntervalSample extends StatelessWidget {
  final double _min = 2.0;
  final double _max = 10.0;
  final SfRangeValues _values = SfRangeValues(4.0, 8.0);

  final List<Data> chartData = <Data>[
    Data(x: 2.0, y: 2.2),
    Data(x: 3.0, y: 3.4),
    Data(x: 4.0, y: 2.8),
    Data(x: 5.0, y: 1.6),
    Data(x: 6.0, y: 2.3),
    Data(x: 7.0, y: 2.5),
    Data(x: 8.0, y: 2.9),
    Data(x: 9.0, y: 3.8),
    Data(x: 10.0, y: 3.7),
  ];

  @override
  Widget build(BuildContext context) {
    return MaterialApp(
      home: Scaffold(
        body: Center(
          child: SfRangeSelector(
            min: _min,
            max: _max,
            interval: 2,
            showLabels: true,
            showTicks: true,
            initialValues: _values,
            child: Container(
              height: 130,
              child: SfCartesianChart(
                margin: const EdgeInsets.all(0),
                primaryXAxis: NumericAxis(
                  minimum: _min,
                  maximum: _max,
                  isVisible: false,
                ),
                primaryYAxis: NumericAxis(isVisible: false),
                plotAreaBorderWidth: 0,
                series: <ColumnSeries<Data, double>>[
                  ColumnSeries<Data, double>(
                    color: Color.fromARGB(255, 126, 184, 253),
                    dataSource: chartData,
                    xValueMapper: (Data sales, int index) => sales.x,
                    yValueMapper: (Data sales, int index) => sales.y)
                ],
              ),
            ),
          ),
        ),
      ),
    );
  }
}
NOTE
- Refer the
showDividersto know about the rendering of dividers at given interval.- Refer the
showTicksto know about the rendering of major ticks at given interval.- Refer the
showLabelsto know about the rendering of labels at given interval.
Date interval
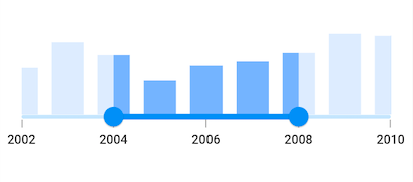
The type of date interval can range from years to seconds. It is mandatory for date SfRangeSelector. The default value of dateIntervalType property is null.
For date values, the Flutter Range Selector does not have auto interval support. So, it is mandatory to set interval, dateIntervalType, and dateFormat for date values.
For example, if min is DateTime(2002, 01, 01) and max is DateTime(2010, 01, 01) and interval is 2, dateIntervalType is DateIntervalType.years, dateFormat is DateFormat.y() then the Flutter Range Selector will render the labels, major ticks, and dividers at 2002, 2004, 2006 and so on.
import 'package:flutter/material.dart';
import 'package:intl/intl.dart';
import 'package:syncfusion_flutter_charts/charts.dart';
import 'package:syncfusion_flutter_sliders/sliders.dart';

class Data {
  Data({required this.x, required this.y});
  final DateTime x;
  final double y;
}

class DateIntervalSample extends StatelessWidget {
  final DateTime _min = DateTime(2002, 01, 01);
  final DateTime _max = DateTime(2010, 01, 01);
  final SfRangeValues _values =
      SfRangeValues(DateTime(2004, 01, 01), DateTime(2008, 01, 01));

  final List<Data> chartData = <Data>[
    Data(x: DateTime(2002, 01, 01), y: 2.2),
    Data(x: DateTime(2003, 01, 01), y: 3.4),
    Data(x: DateTime(2004, 01, 01), y: 2.8),
    Data(x: DateTime(2005, 01, 01), y: 1.6),
    Data(x: DateTime(2006, 01, 01), y: 2.3),
    Data(x: DateTime(2007, 01, 01), y: 2.5),
    Data(x: DateTime(2008, 01, 01), y: 2.9),
    Data(x: DateTime(2009, 01, 01), y: 3.8),
    Data(x: DateTime(2010, 01, 01), y: 3.7),
  ];

  @override
  Widget build(BuildContext context) {
    return MaterialApp(
      home: Scaffold(
        body: Center(
          child: SfRangeSelector(
            min: _min,
            max: _max,
            showLabels: true,
            showTicks: true,
            interval: 2,
            dateFormat: DateFormat.y(),
            dateIntervalType: DateIntervalType.years,
            initialValues: _values,
            child: Container(
              height: 130,
              child: SfCartesianChart(
                margin: const EdgeInsets.all(0),
                primaryXAxis: DateTimeAxis(
                  minimum: _min,
                  maximum: _max,
                  isVisible: false,
                ),
                primaryYAxis: NumericAxis(isVisible: false),
                plotAreaBorderWidth: 0,
                series: <ColumnSeries<Data, DateTime>>[
                  ColumnSeries<Data, DateTime>(
                    color: Color.fromARGB(255, 126, 184, 253),
                    dataSource: chartData,
                    xValueMapper: (Data sales, int index) => sales.x,
                    yValueMapper: (Data sales, int index) => sales.y)
                ],
              ),
            ),
          ),
        ),
      ),
    );
  }
}
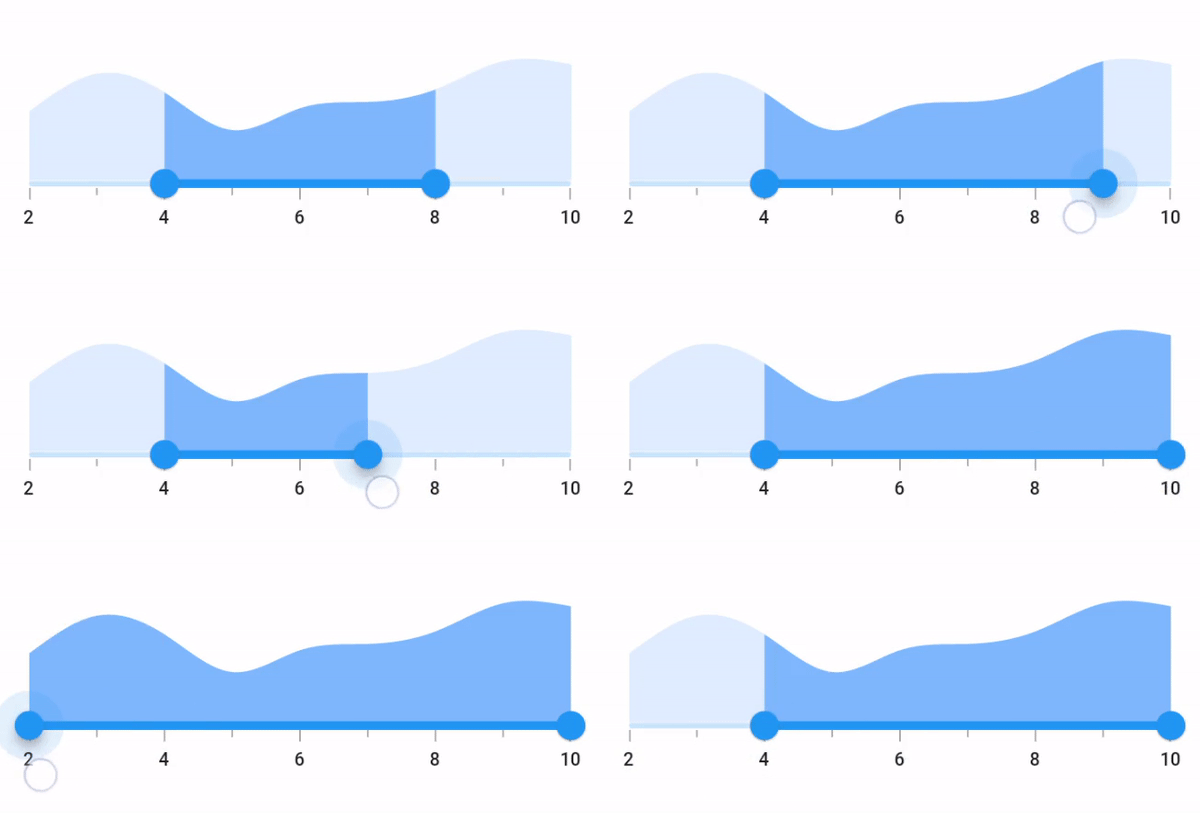
Discrete selection for numeric values
You can move the thumb in discrete manner for numeric values using the stepSize property in the Flutter Range Selector.
import 'package:flutter/material.dart';
import 'package:syncfusion_flutter_charts/charts.dart';
import 'package:syncfusion_flutter_sliders/sliders.dart';

class Data {
  Data({required this.x, required this.y});
  final double x;
  final double y;
}

class StepSizeSample extends StatelessWidget {
  final double _min = 2.0;
  final double _max = 10.0;
  final SfRangeValues _values = SfRangeValues(4.0, 8.0);

  final List<Data> chartData = <Data>[
    Data(x: 2.0, y: 2.2),
    Data(x: 3.0, y: 3.4),
    Data(x: 4.0, y: 2.8),
    Data(x: 5.0, y: 1.6),
    Data(x: 6.0, y: 2.3),
    Data(x: 7.0, y: 2.5),
    Data(x: 8.0, y: 2.9),
    Data(x: 9.0, y: 3.8),
    Data(x: 10.0, y: 3.7),
  ];

  @override
  Widget build(BuildContext context) {
    return MaterialApp(
      home: Scaffold(
        body: Center(
          child: SfRangeSelector(
            min: _min,
            max: _max,
            interval: 2,
            stepSize: 1,
            showLabels: true,
            showTicks: true,
            minorTicksPerInterval: 1,
            initialValues: _values,
            child: Container(
              height: 130,
              child: SfCartesianChart(
                margin: const EdgeInsets.all(0),
                primaryXAxis: NumericAxis(
                  minimum: _min,
                  maximum: _max,
                  isVisible: false,
                ),
                primaryYAxis: NumericAxis(isVisible: false),
                plotAreaBorderWidth: 0,
                series: <SplineAreaSeries<Data, double>>[
                  SplineAreaSeries<Data, double>(
                    color: Color.fromARGB(255, 126, 184, 253),
                    dataSource: chartData,
                    xValueMapper: (Data sales, int index) => sales.x,
                    yValueMapper: (Data sales, int index) => sales.y)
                ],
              ),
            ),
          ),
        ),
      ),
    );
  }
}
Discrete selection for date values
You can move the thumb in discrete manner for date values based on the value provided in the stepDuration property in the Flutter Range Selector.
For example, if min is DateTime(2015, 01, 01) and max is DateTime(2020, 01, 01) and stepDuration is SliderStepDuration(years: 1, months: 6), the Flutter Range Selector will move the thumbs to DateTime(2015, 01, 01), DateTime(2016, 07, 01), DateTime(2018, 01, 01), DateTime(2019, 07, 01), and so on.
import 'package:flutter/material.dart';
import 'package:intl/intl.dart';
import 'package:syncfusion_flutter_charts/charts.dart';
import 'package:syncfusion_flutter_sliders/sliders.dart';

class Data {
  Data({required this.x, required this.y});
  final DateTime x;
  final double y;
}

class StepDurationSample extends StatelessWidget {
  final DateTime _min = DateTime(2015, 01, 01);
  final DateTime _max = DateTime(2020, 01, 01);
  final SfRangeValues _values =
      SfRangeValues(DateTime(2016, 07, 01), DateTime(2018, 01, 01));

  final List<Data> chartData = <Data>[
    Data(x: DateTime(2015, 01, 01), y: 2.2),
    Data(x: DateTime(2016, 01, 01), y: 3.4),
    Data(x: DateTime(2016, 07, 01), y: 2.8),
    Data(x: DateTime(2017, 01, 01), y: 1.6),
    Data(x: DateTime(2018, 01, 01), y: 2.3),
    Data(x: DateTime(2018, 07, 01), y: 2.5),
    Data(x: DateTime(2019, 01, 01), y: 2.9),
    Data(x: DateTime(2019, 07, 01), y: 3.8),
    Data(x: DateTime(2020, 01, 01), y: 3.7),
  ];

  @override
  Widget build(BuildContext context) {
    return MaterialApp(
      home: Scaffold(
        body: Center(
          child: SfRangeSelector(
            min: _min,
            max: _max,
            showLabels: true,
            showTicks: true,
            interval: 2,
            stepDuration: SliderStepDuration(years: 1, months: 6),
            dateFormat: DateFormat.y(),
            dateIntervalType: DateIntervalType.years,
            initialValues: _values,
            child: Container(
              height: 130,
              child: SfCartesianChart(
                margin: const EdgeInsets.all(0),
                primaryXAxis: DateTimeAxis(
                  minimum: _min,
                  maximum: _max,
                  isVisible: false,
                ),
                primaryYAxis: NumericAxis(isVisible: false),
                plotAreaBorderWidth: 0,
                series: <SplineAreaSeries<Data, DateTime>>[
                  SplineAreaSeries<Data, DateTime>(
                    color: Color.fromARGB(255, 126, 184, 253),
                    dataSource: chartData,
                    xValueMapper: (Data sales, int index) => sales.x,
                    yValueMapper: (Data sales, int index) => sales.y)
                ],
              ),
            ),
          ),
        ),
      ),
    );
  }
}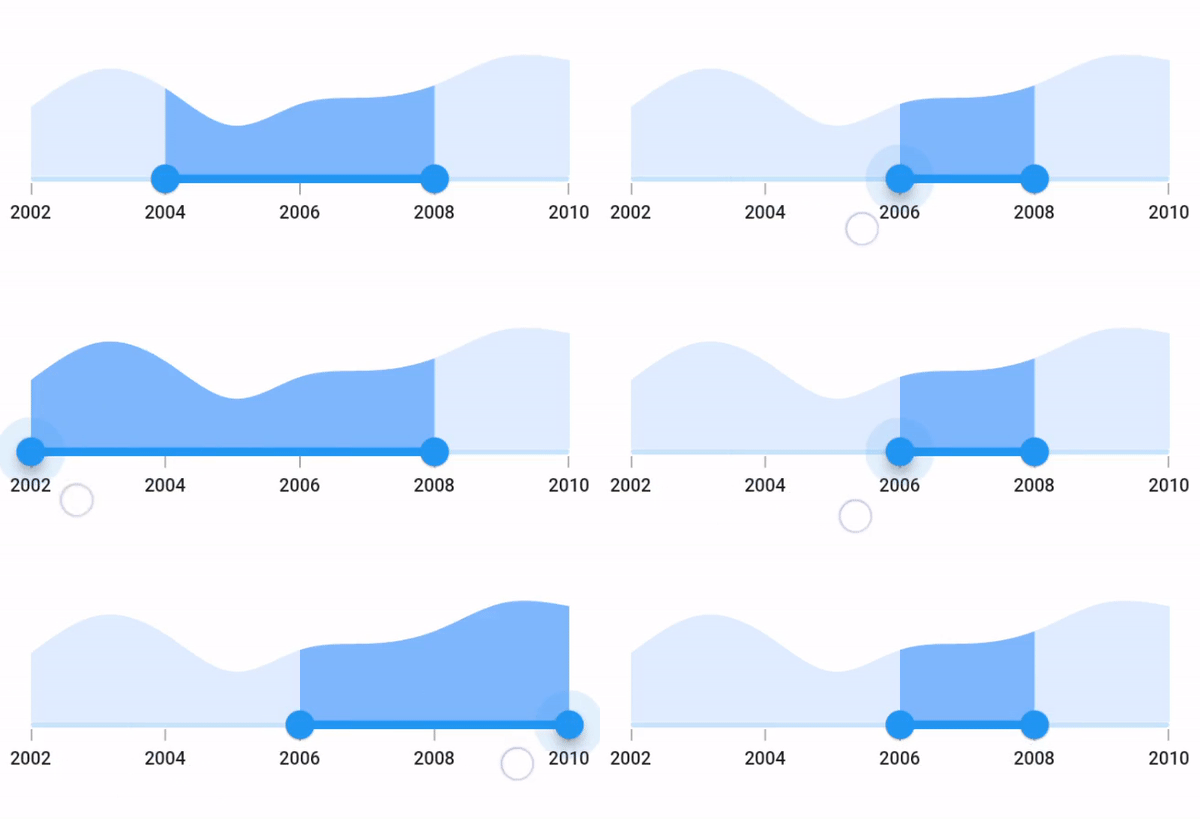
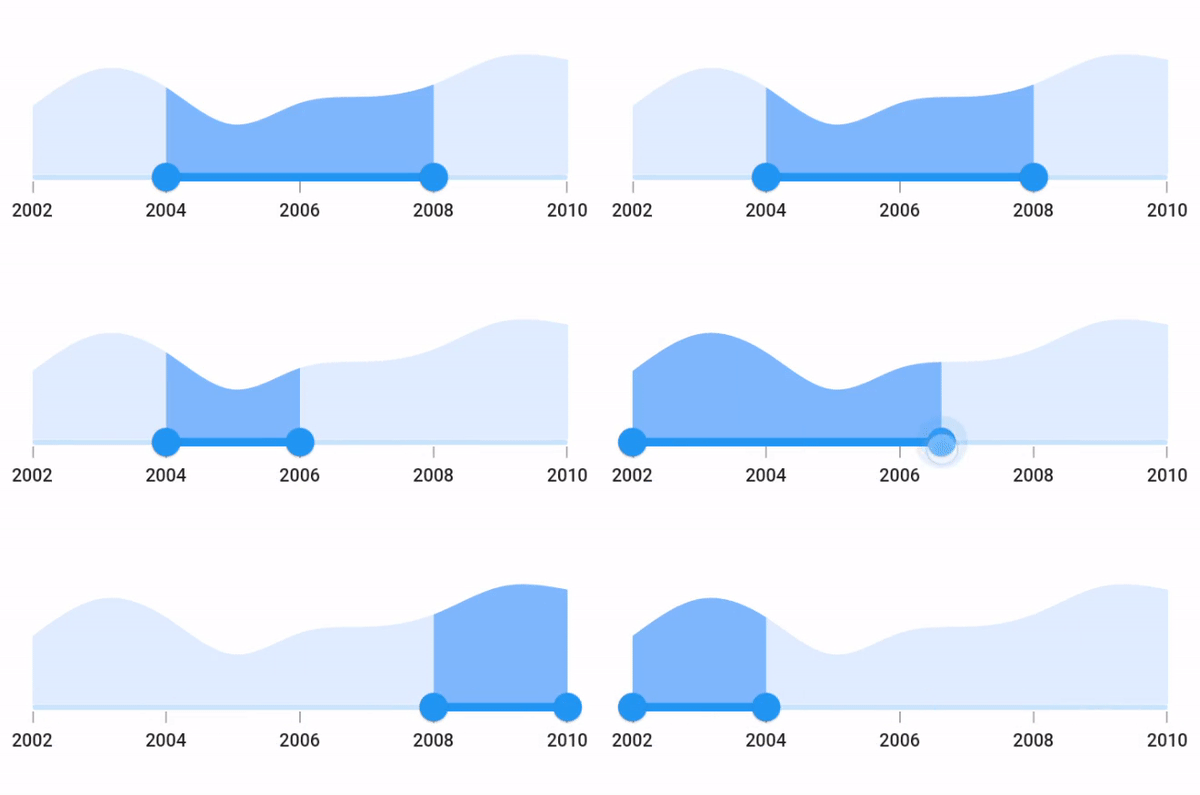
Enable interval selection
You can select a particular interval by tapping when setting the enableIntervalSelection property as true. Both thumbs will be moved to the current interval with animation.
import 'package:flutter/material.dart';
import 'package:intl/intl.dart';
import 'package:syncfusion_flutter_charts/charts.dart';
import 'package:syncfusion_flutter_sliders/sliders.dart';

class Data {
  Data({required this.x, required this.y});
  final DateTime x;
  final double y;
}

class IntervalSelectionSample extends StatelessWidget {
  final DateTime _min = DateTime(2002, 01, 01);
  final DateTime _max = DateTime(2010, 01, 01);
  final SfRangeValues _values =
      SfRangeValues(DateTime(2004, 01, 01), DateTime(2008, 01, 01));

  final List<Data> chartData = <Data>[
    Data(x: DateTime(2002, 01, 01), y: 2.2),
    Data(x: DateTime(2003, 01, 01), y: 3.4),
    Data(x: DateTime(2004, 01, 01), y: 2.8),
    Data(x: DateTime(2005, 01, 01), y: 1.6),
    Data(x: DateTime(2006, 01, 01), y: 2.3),
    Data(x: DateTime(2007, 01, 01), y: 2.5),
    Data(x: DateTime(2008, 01, 01), y: 2.9),
    Data(x: DateTime(2009, 01, 01), y: 3.8),
    Data(x: DateTime(2010, 01, 01), y: 3.7),
  ];

  @override
  Widget build(BuildContext context) {
    return MaterialApp(
      home: Scaffold(
        body: Center(
          child: SfRangeSelector(
            min: _min,
            max: _max,
            showLabels: true,
            showTicks: true,
            interval: 2,
            enableIntervalSelection: true,
            dateFormat: DateFormat.y(),
            dateIntervalType: DateIntervalType.years,
            initialValues: _values,
            child: Container(
              height: 130,
              child: SfCartesianChart(
                margin: const EdgeInsets.all(0),
                primaryXAxis: DateTimeAxis(
                  minimum: _min,
                  maximum: _max,
                  isVisible: false,
                ),
                primaryYAxis: NumericAxis(isVisible: false),
                plotAreaBorderWidth: 0,
                series: <SplineAreaSeries<Data, DateTime>>[
                  SplineAreaSeries<Data, DateTime>(
                    color: Color.fromARGB(255, 126, 184, 253),
                    dataSource: chartData,
                    xValueMapper: (Data sales, int index) => sales.x,
                    yValueMapper: (Data sales, int index) => sales.y)
                ],
              ),
            ),
          ),
        ),
      ),
    );
  }
}