How can I help you?
Positioning Data Markers in WPF SfChart3D
29 Apr 20267 minutes to read
The positioning of adornments inside the series is defined using AdornmentPosition property.
-
Top- Positions the Adornment at the top edge point of a chart segment. -
Bottom- Positions the Adornment at the bottom edge point of a chart segment. -
TopAndBottom- Positions the Adornment at the center point of a chart segment.
NOTE
This behavior varies based on the chart series type.
The following code example shows the how to specify connector type:
<chart:ColumnSeries3D
    ItemsSource="{Binding CategoricalData}"
    XBindingPath="Year"
    YBindingPath="Plastic">
    <chart:ColumnSeries3D.AdornmentsInfo>
        <chart:ChartAdornmentInfo3D
            ShowMarker="True"
            SymbolHeight="10"
            SymbolWidth="10"
            Symbol="Diamond"
            AdornmentsPosition="TopAndBottom"
            SymbolInterior="#FF64B5F6">
        </chart:ChartAdornmentInfo3D>
    </chart:ColumnSeries3D.AdornmentsInfo>
</chart:ColumnSeries3D>
ColumnSeries3D series = new ColumnSeries3D()
{
ItemsSource = new CategoryDataViewModel().CategoricalData,
XBindingPath = "Year",
YBindingPath = "Plastic",
};
ChartAdornmentInfo3D adornmentInfo = new ChartAdornmentInfo3D()
{
ShowLabel = true,
ShowMarker = true,
AdornmentsPosition=AdornmentsPosition.TopAndBottom,
SymbolHeight=10,
SymbolWidth=10
};
series.AdornmentsInfo = adornmentInfo;
chart.Series.Add(series);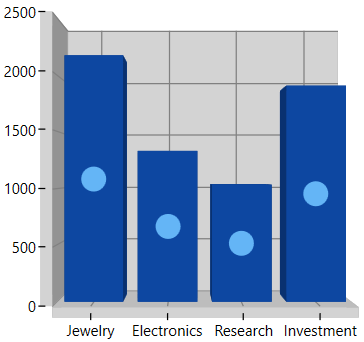
Label Position
SfChart3D provides additional customization option to position the adornments smartly based on series types using LabelPosition property.
The following section shows few examples for this LabelPosition behavior with respect to the series.
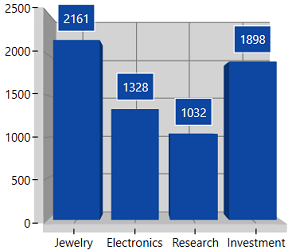
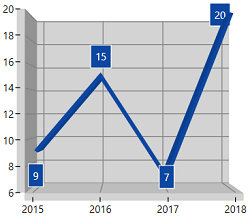
Auto
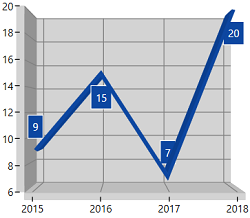
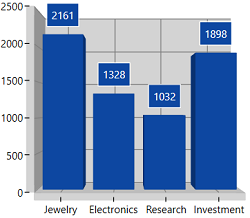
The Auto position of Labels with respect to ColumnSeries3D and LineSeries3D.
<chart:ChartAdornmentInfo3D
    UseSeriesPalette="True"
    LabelPosition="Auto"
    ShowLabel="True"
    BorderBrush="White" BorderThickness="1">
</chart:ChartAdornmentInfo3D>
ChartAdornmentInfo3D adornmentInfo = new ChartAdornmentInfo3D()
{
ShowLabel = true,
ShowMarker = true,
BorderBrush = new SolidColorBrush(Colors.White),
LabelPosition=AdornmentsLabelPosition.Auto,
UseSeriesPalette=true,
BorderThickness = new Thickness(1),
};| Column Series | Line Series |
|---|---|
 |
 |
Inner
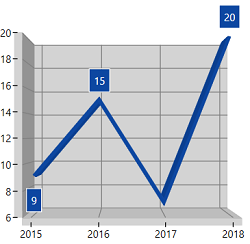
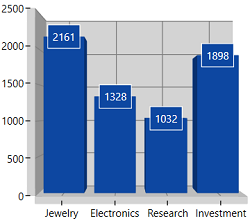
The Inner position of Labels with respect to ColumnSeries3D and LineSeries3D.
<chart:ChartAdornmentInfo3D
    UseSeriesPalette="True"
    LabelPosition="Inner"
    ShowLabel="True"
    BorderBrush="White" BorderThickness="1">
</chart:ChartAdornmentInfo3D>
ChartAdornmentInfo3D adornmentInfo = new ChartAdornmentInfo3D()
{
ShowLabel = true,
ShowMarker = true,
BorderBrush = new SolidColorBrush(Colors.White),
LabelPosition=AdornmentsLabelPosition.Inner,
UseSeriesPalette=true,
BorderThickness = new Thickness(1),
};| Column Series | Line Series |
|---|---|
 |
 |
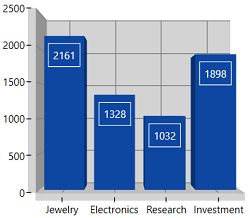
Outer
The Outer position of Labels with respect to ColumnSeries3D and LineSeries3D.
<chart:ChartAdornmentInfo3D
    UseSeriesPalette="True"
    LabelPosition="Outer"
    ShowLabel="True"
    BorderBrush="White" BorderThickness="1">
</chart:ChartAdornmentInfo3D>
ChartAdornmentInfo3D adornmentInfo = new ChartAdornmentInfo3D()
{
ShowLabel = true,
ShowMarker = true,
BorderBrush = new SolidColorBrush(Colors.White),
LabelPosition=AdornmentsLabelPosition.Outer,
UseSeriesPalette=true,
BorderThickness = new Thickness(1),
};| Column Series | Line Series |
|---|---|
 |
 |
Center
The Center position of Labels with respect to ColumnSeries3D and LineSeries3D.
<chart:ChartAdornmentInfo3D
    UseSeriesPalette="True"
    LabelPosition="Center"
    ShowLabel="True"
    BorderBrush="White" BorderThickness="1">
</chart:ChartAdornmentInfo3D>
ChartAdornmentInfo3D adornmentInfo = new ChartAdornmentInfo3D()
{
ShowLabel = true,
ShowMarker = true,
BorderBrush = new SolidColorBrush(Colors.White),
LabelPosition=AdornmentsLabelPosition.Center,
UseSeriesPalette=true,
BorderThickness = new Thickness(1),
};| Column Series | Line Series |
|---|---|
 |
 |