Draw Sparkline Report Item
2 Jun 20212 minutes to read
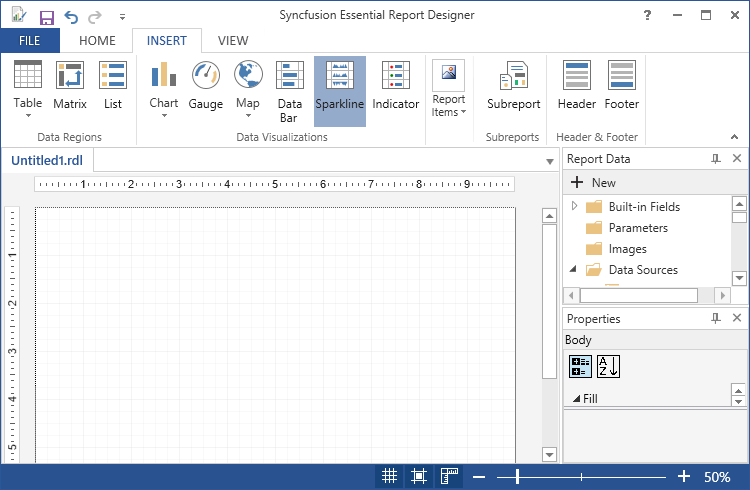
You can add a sparkline to the Report Designer using the following steps.
-
Click sparkline in the Insert Tab and drag it to the Report designer.
-
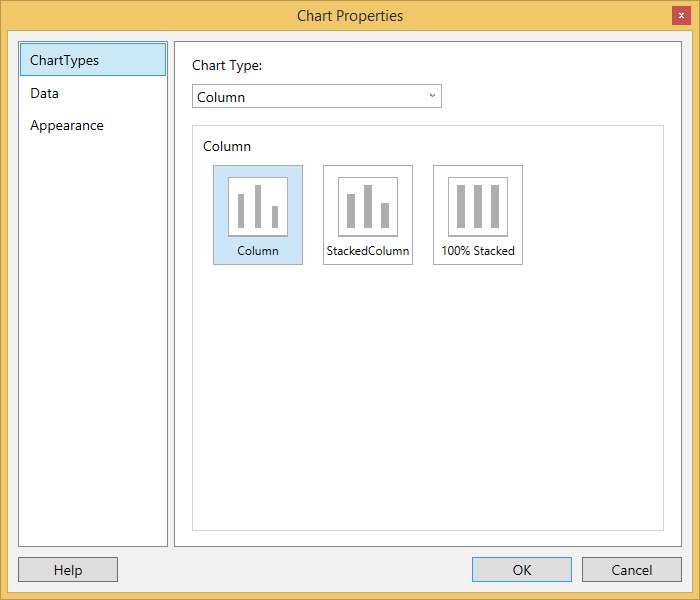
A Chart properties wizard opens, Click Ok.Then sparkline will be added with its default properties.

-
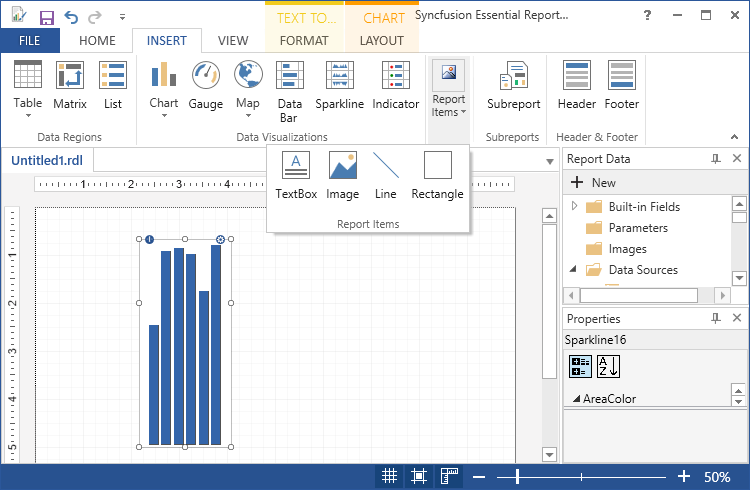
To Add the Report Items such as text boxes, lines, and images and rectangle to the sparkline,click and drag the selected report items to the sparkline.
-
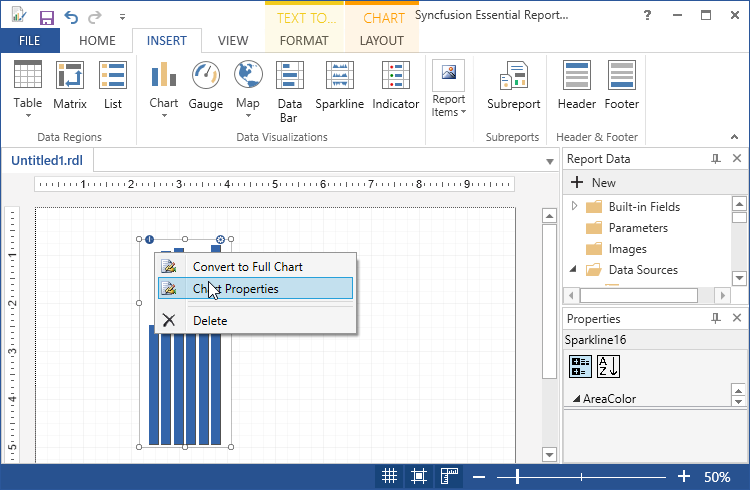
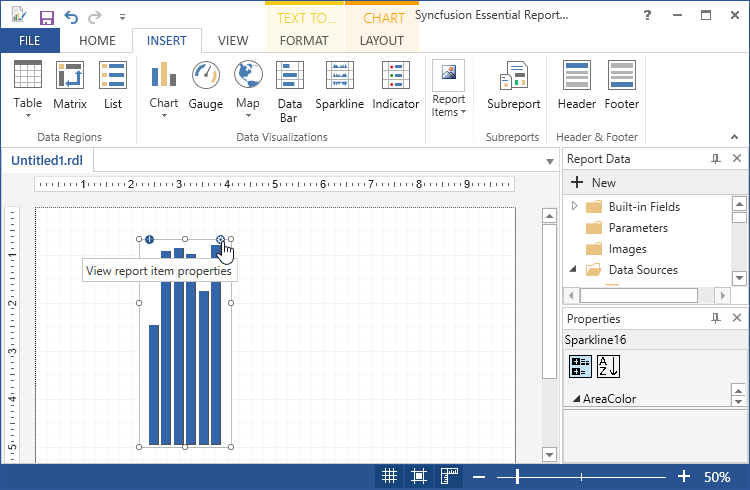
To Apply Styles to the sparkline, Right Click on the sparkline and select the Chart Properties from the context menu or click on the view report item properties.
-
In the Chart Properties dialog, select any of the following.
-
General - To change the sparkline type and ToolTip of the chart.
-
Data - To set the Dataset name and data fields of the corresponding datasets.
-
Appearance - To set the Chart name and border options and background options.
-
-
Click Ok.Then the values are updated in the sparkline.
-
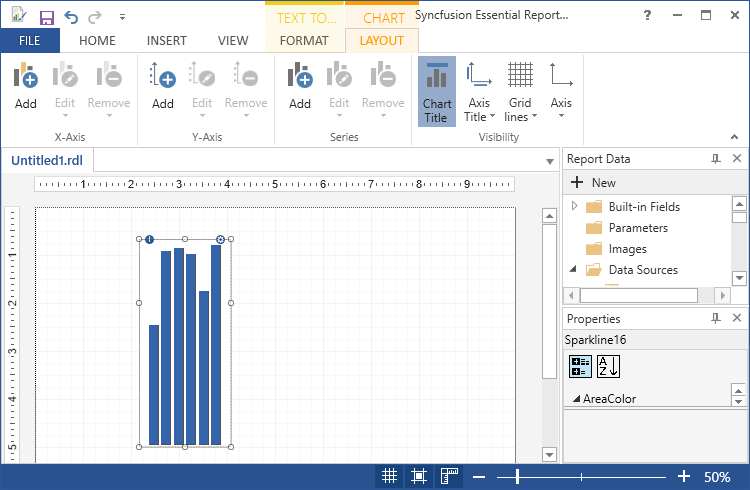
Select properties like chart title, axis title, grid lines, axis and add chart in x axis, y axis and series in Layout tab.
-
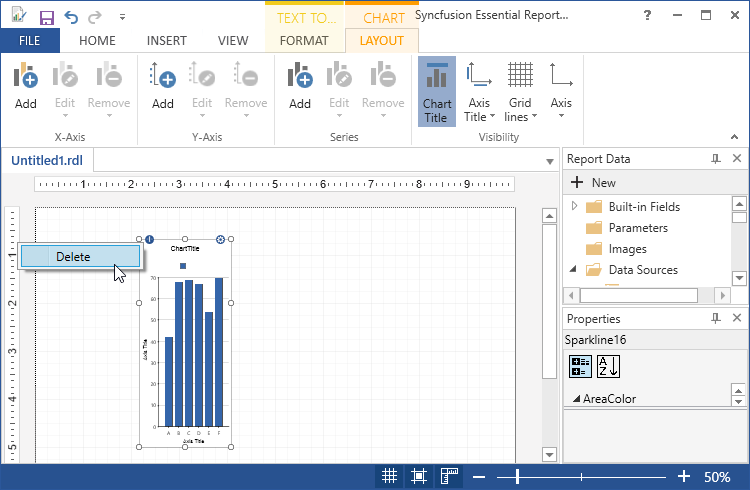
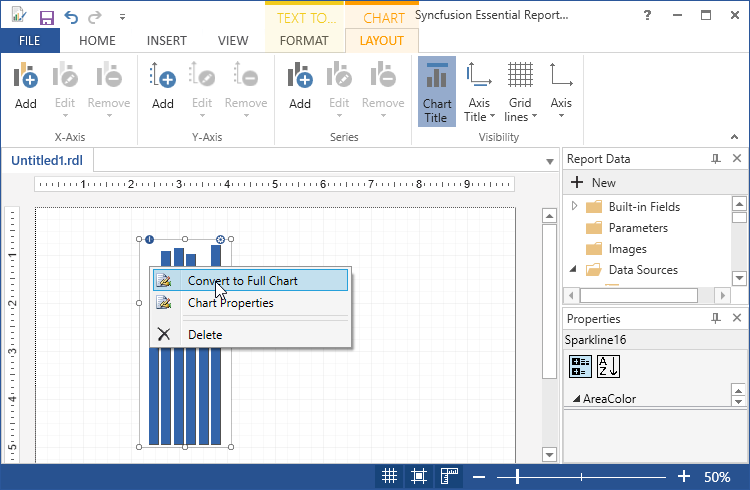
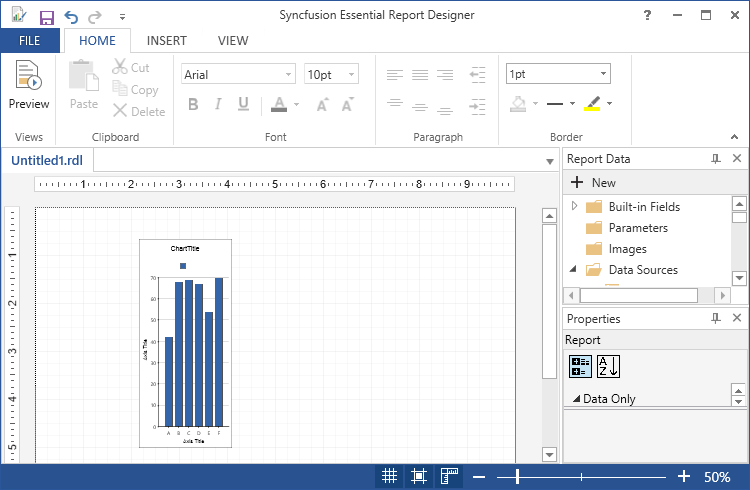
To convert the sparkline to chart, Right click on the sparkline and select convert to full chart.
-
Then the sparkline will converted into the chart.
-
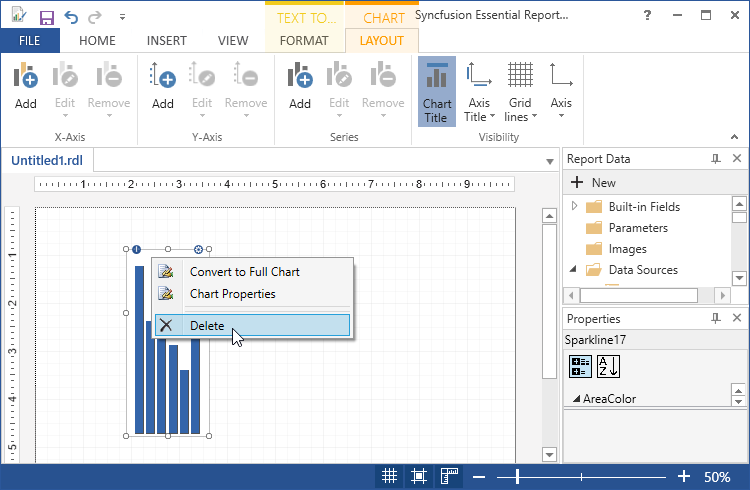
To delete the sparkline, right click and select delete.