Draw Matrix Report Item
2 Jun 20211 minute to read
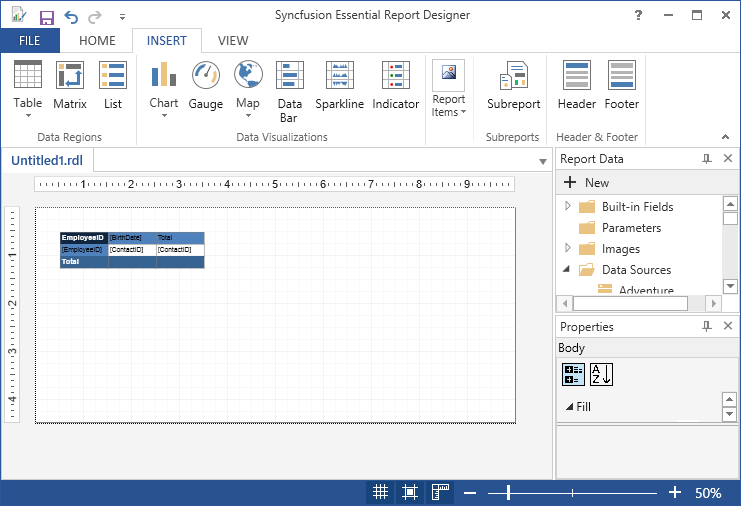
You can follow these steps to add a Matrix to the Report Designer.
-
Add a data set to the Report Designer.
-
Click Matrix in the Insert Tabs.
-
New Matrix wizard opens.
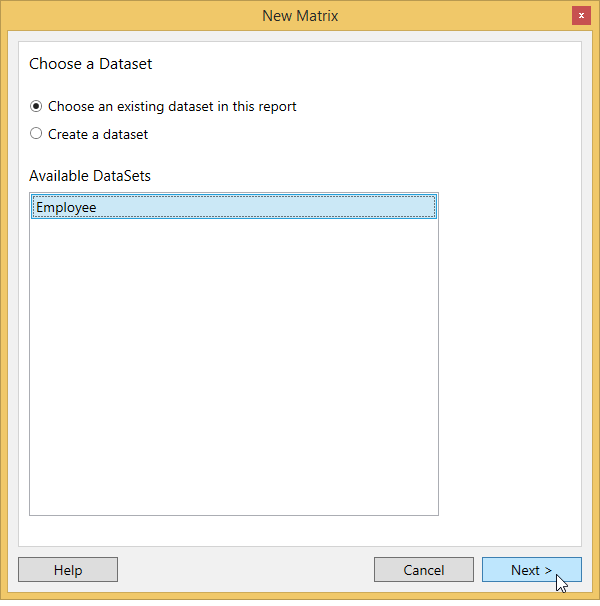
- Choose an existing dataset in this report,if any dataset is added in the report designer.
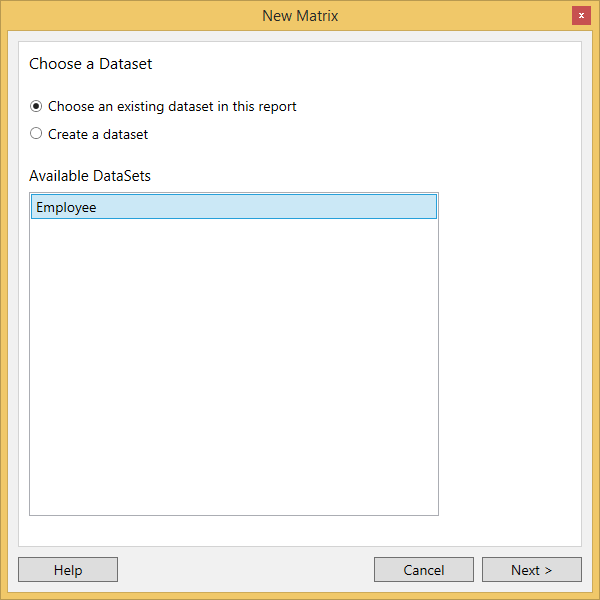
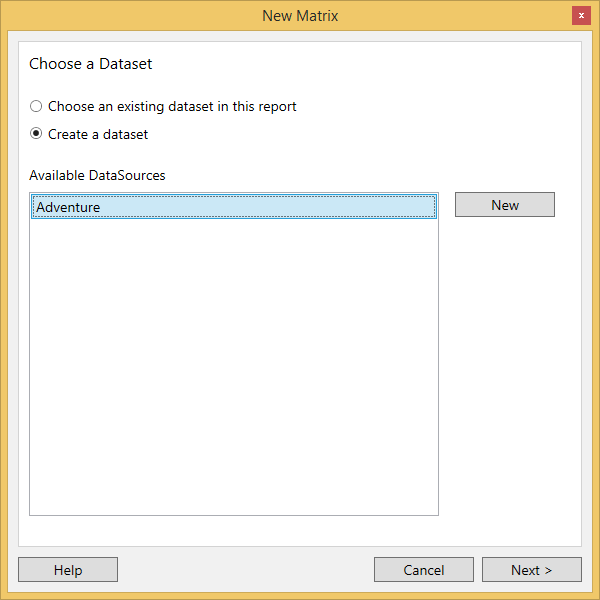
- Choose create a dataset,if dataset is not added in the report designer.
-
Click Next after selecting create a dataset and choose the datasource in the available datasources.
-
Select any fields from the database view and click Run Query.
-
Then the Query Result will be displayed according to the query selection.
-
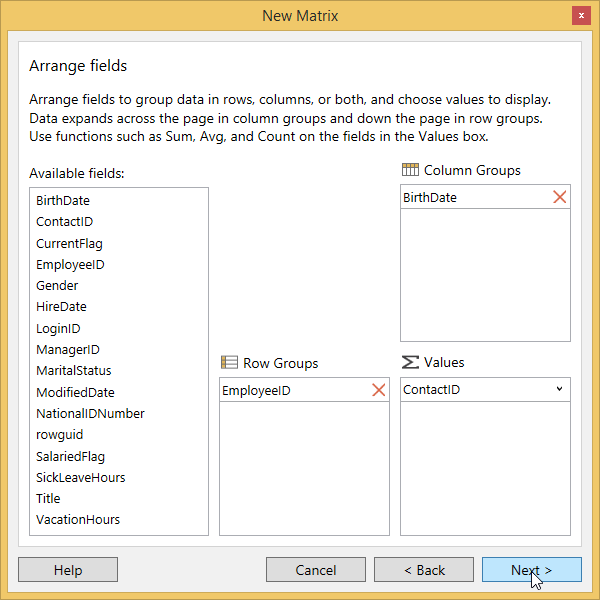
Click Next.Then Arrange fields windows will display.
-
Drag the required fields from the Available fields to Row Groups, Column Groups, and Values fields.
-
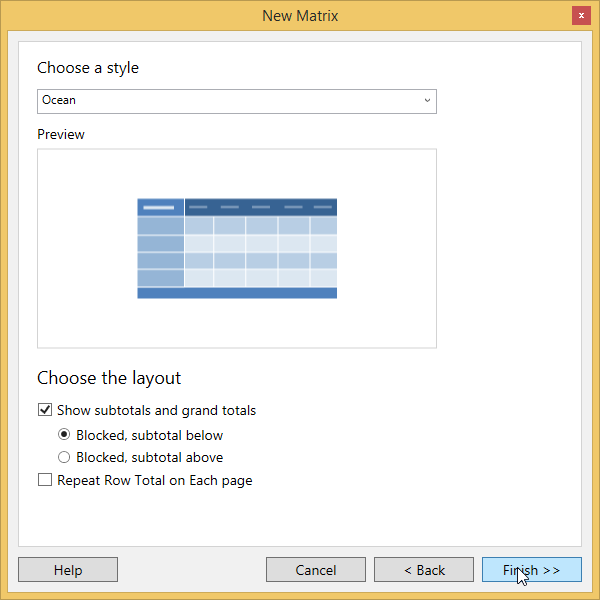
Click Next.Then choose a style and layout and click Finish.
-
A matrix is added to the Report Designer with the selected data fields.