Tooltip in WPF Maps (SfMap)
23 Jul 202124 minutes to read
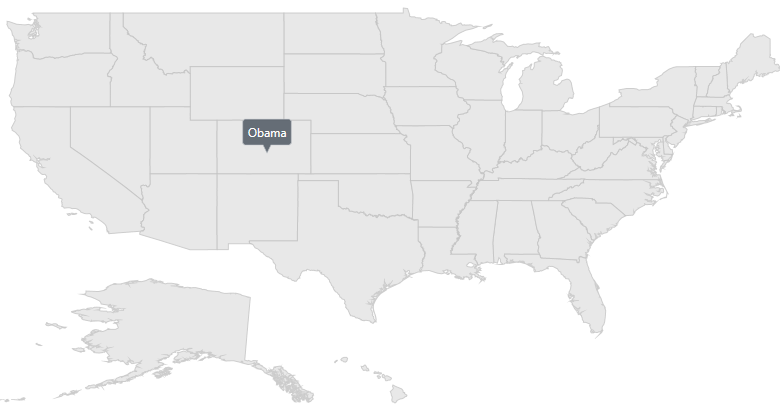
Tooltip provides additional information about the shapes in the maps. To enable tooltip, set the ShowTooltip property to true, and set the ValuePath property of tooltip.
Tooltip is displayed by tapping the following elements:
• Shapes
• Bubbles
• Markers
Enable the tooltip by tapping the shapes in shapeFileLayer
<maps:SfMap>
            <maps:SfMap.Layers>
               <maps:ShapeFileLayer Uri="MapsZoom.ShapeFiles.usa_state.shp" ItemsSource="{Binding Data}" ShapeIDPath="State" ShapeIDTableField="STATE_NAME" EnableSelection="False" LabelPath="State">
                  <maps:ShapeFileLayer.ShapeSettings>
                        <maps:ShapeSetting   ShapeStrokeThickness="1" ></maps:ShapeSetting>
                    </maps:ShapeFileLayer.ShapeSettings>
                    <maps:ShapeFileLayer.ToolTipSettings>
                        <maps:ToolTipSetting ValuePath="Candidate" x:Name="shapeTooltipSettings" >
                        </maps:ToolTipSetting>
                    </maps:ShapeFileLayer.ToolTipSettings>
                    <maps:ShapeFileLayer.ItemsTemplate>
                        <DataTemplate>
                            <Border >
                                <TextBlock FontFamily="Segoe UI" FontSize="12" Foreground="#FF333333" Text=""/>
                            </Border>
                        </DataTemplate>
                    </maps:ShapeFileLayer.ItemsTemplate>
                </maps:ShapeFileLayer>
	       </maps:SfMap.Layers>
        </maps:SfMap>
public class ElectionData
{
public ElectionData(string state, string candidate, int electors)
{
State = state;
Candidate = candidate;
Electors = electors;
}
public string State
{
get;
set;
}
public string Candidate
{
get;
set;
}
public int Electors
{
get;
set;
}
}
public class ViewModel
{
public ObservableCollection<ElectionData> Data { get; set; }
public ViewModel()
{
Data = new ObservableCollection<ElectionData>();
Data.Add(new ElectionData("Alabama", "Romney", 9));
Data.Add(new ElectionData("Alaska", "Romney", 3));
Data.Add(new ElectionData("Arizona", "Romney", 11));
Data.Add(new ElectionData("Arkansas", "Romney", 6));
Data.Add(new ElectionData("California", "Romney", 55));
Data.Add(new ElectionData("Colorado", "Obama", 9));
Data.Add(new ElectionData("Connecticut", "Obama", 7));
Data.Add(new ElectionData("Delaware", "Obama", 3));
Data.Add(new ElectionData("District of Columbia", "Obama", 3));
Data.Add(new ElectionData("Florida", "Obama", 29));
Data.Add(new ElectionData("Georgia", "Obama", 16));
Data.Add(new ElectionData("Hawaii", "Romney", 4));
Data.Add(new ElectionData("Idaho", "Obama", 4));
Data.Add(new ElectionData("Illinois", "Romney", 20));
Data.Add(new ElectionData("Indiana", "Obama", 11));
Data.Add(new ElectionData("Iowa", "Romney", 6));
Data.Add(new ElectionData("Kansas", "Obama", 6));
Data.Add(new ElectionData("Kentucky", "Romney", 8));
Data.Add(new ElectionData("Louisiana", "Romney", 8));
Data.Add(new ElectionData("Maine", "Romney", 4));
Data.Add(new ElectionData("Maryland", "Obama", 10));
}
}
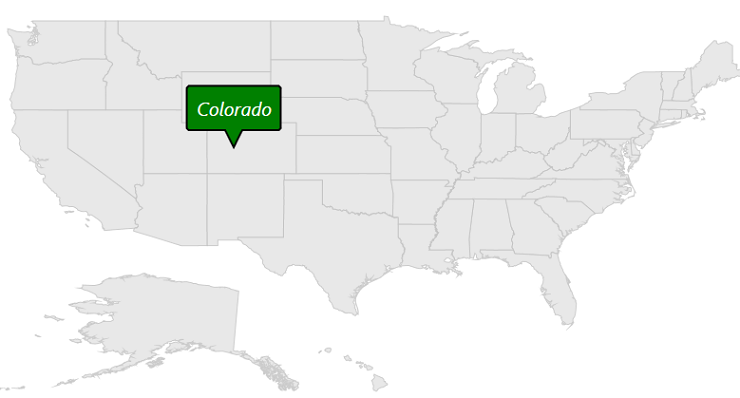
Tooltip customization
The appearance of the tooltip can be customized using the following properties:
Foreground : Customizes the text color of tooltip.
Background : Customizes the background color of tooltip.
Stroke : Customizes the stroke color of tooltip.
StrokeThickness : Customizes the stroke width of tooltip.
ShowDuration : Specifies the duration of tooltip to be displayed.
Margin : Sets the margin for tooltip.
FontFamily : Customizes the text font family of tooltip.
FontStyle : Customizes the font style of tooltip text.
FontSize : Customizes the font size of tooltip text.
PointerLength : Customizes the tooltip pointer length.
The following code sample shows all the above customizations.
<maps:ShapeFileLayer.ToolTipSettings>
         <maps:ToolTipSetting ValuePath="State" PointerLength="18" FontFamily="Segoe UI" FontStyle="Italic" FontSize="20" Foreground="White" Margin="10" Background="Green"  Stroke="Black" StrokeThickness="2" ShowDuration="2000" />
</maps:ShapeFileLayer.ToolTipSettings>shapeFileLayer.ToolTipSettings.Background = new SolidColorBrush(Colors.White);
shapeFileLayer.ToolTipSettings.Background = new SolidColorBrush(Colors.Green);
shapeFileLayer.ToolTipSettings.Stroke = new SolidColorBrush(Colors.Black);
shapeFileLayer.ToolTipSettings.StrokeThickness = 2;
shapeFileLayer.ToolTipSettings.Margin = new Thickness(10);
shapeFileLayer.ToolTipSettings.ShowDuration = 2000;
shapeFileLayer.ToolTipSettings.FontSize = 20;
shapeFileLayer.ToolTipSettings.FontStyle = FontStyles.Italic;
shapeFileLayer.ToolTipSettings.FontFamily = new FontFamily("Segoe UI");
shapeFileLayer.ToolTipSettings.PointerLength = 18;NOTE
Similarly we can customize the bubble and marker tooltip also.
Custom template for tooltip
The maps control provides options to design your own template for tooltip using the TooltipTemplate property.
<Grid x:Name="grid">
            <Grid.Resources>
                <DataTemplate x:Key="toolTipTemplate">
                    <TextBlock Foreground="Yellow" Text="{Binding Data.Candidate}"/>
                </DataTemplate>
            </Grid.Resources>

            <maps:ShapeFileLayer.ToolTipSettings>
                <maps:ToolTipSetting ShowDuration="3000" ToolTipTemplate="{StaticResource ResourceKey=toolTipTemplate}"/>
            </maps:ShapeFileLayer.ToolTipSettings>
	    </Grid>
ToolTipSetting toolTipSetting = new ToolTipSetting();
toolTipSetting.ShowDuration = 3000;
DataTemplate template = this.grid.Resources["toolTipTemplate"] as DataTemplate;
toolTipSetting.ToolTipTemplate = template;
shapeFile.ToolTipSettings = toolTipSetting;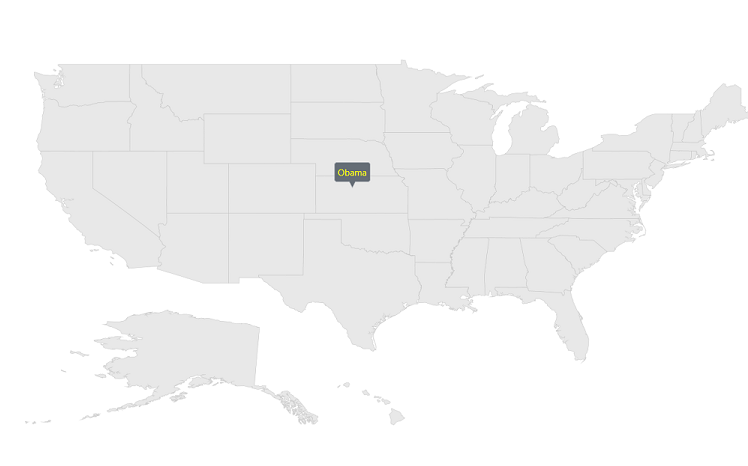
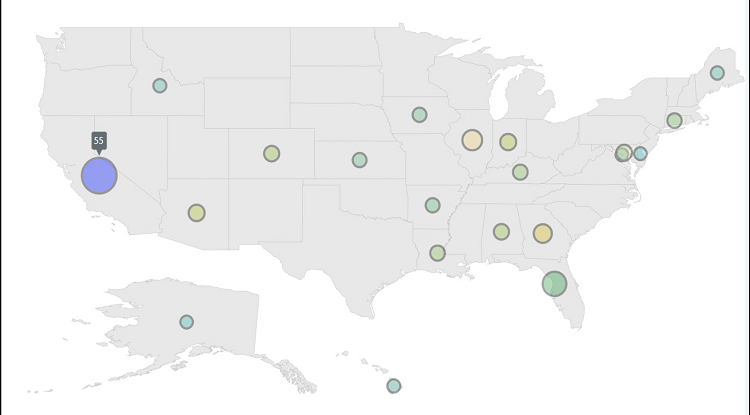
Enable tooltip by tapping the Bubbles in shapeFileLayer
<maps:SfMap x:Name="map">
            <maps:SfMap.Layers>
                <maps:ShapeFileLayer Uri="MapsZoom.ShapeFiles.usa_state.shp" ItemsSource="{Binding Data}" ShapeIDPath="State" ShapeIDTableField="STATE_NAME" EnableSelection="False" LabelPath="State">
                    <maps:ShapeFileLayer.ItemsTemplate>
                        <DataTemplate>
                            <Border >
                                <TextBlock FontFamily="Segoe UI" FontSize="12" Foreground="#FF333333"  Text=""/>
                            </Border>
                        </DataTemplate>
                    </maps:ShapeFileLayer.ItemsTemplate>

                    <maps:ShapeFileLayer.BubbleMarkerSetting>
                        <maps:BubbleMarkerSetting  MinSize="20" MaxSize="50" ValuePath="Electors"  ColorValuePath="Electors" Stroke="Black" StrokeThickness="3">
                            <maps:BubbleMarkerSetting.ToolTipSettings >
                                <maps:ToolTipSetting  ValuePath="Electors">
                                </maps:ToolTipSetting>
                            </maps:BubbleMarkerSetting.ToolTipSettings>
                            <maps:BubbleMarkerSetting.ColorMappings>
                                <maps:RangeColorMapping Color="#7F20BCEE" To="0" From="10"/>
                                <maps:RangeColorMapping Color="#7FA7CE38" To="10" From="20"/>
                                <maps:RangeColorMapping Color="#7FF1B21A" To="20" From="30"/>
                                <maps:RangeColorMapping Color="#7F1DA249" To="30" From="40"/>
                                <maps:RangeColorMapping Color="#7FEB737C" To="40" From="50"/>
                                <maps:RangeColorMapping Color="#7FED2D95" To="50" From="60"/>
                            </maps:BubbleMarkerSetting.ColorMappings>
                        </maps:BubbleMarkerSetting>
                    </maps:ShapeFileLayer.BubbleMarkerSetting>
                </maps:ShapeFileLayer>
            </maps:SfMap.Layers>
        </maps:SfMap>
public class ElectionData
{
public ElectionData(string state, string candidate, int electors)
{
State = state;
Candidate = candidate;
Electors = electors;
}
public string State
{
get;
set;
}
public string Candidate
{
get;
set;
}
public int Electors
{
get;
set;
}
}
public class ViewModel
{
public ObservableCollection<ElectionData> Data { get; set; }
public ViewModel()
{
Data = new ObservableCollection<ElectionData>();
Data.Add(new ElectionData("Alabama", "Romney", 9));
Data.Add(new ElectionData("Alaska", "Romney", 3));
Data.Add(new ElectionData("Arizona", "Romney", 11));
Data.Add(new ElectionData("Arkansas", "Romney", 6));
Data.Add(new ElectionData("California", "Romney", 55));
Data.Add(new ElectionData("Colorado", "Obama", 9));
Data.Add(new ElectionData("Connecticut", "Obama", 7));
Data.Add(new ElectionData("Delaware", "Obama", 3));
Data.Add(new ElectionData("District of Columbia", "Obama", 3));
Data.Add(new ElectionData("Florida", "Obama", 29));
Data.Add(new ElectionData("Georgia", "Obama", 16));
Data.Add(new ElectionData("Hawaii", "Romney", 4));
Data.Add(new ElectionData("Idaho", "Obama", 4));
Data.Add(new ElectionData("Illinois", "Romney", 20));
Data.Add(new ElectionData("Indiana", "Obama", 11));
Data.Add(new ElectionData("Iowa", "Romney", 6));
Data.Add(new ElectionData("Kansas", "Obama", 6));
Data.Add(new ElectionData("Kentucky", "Romney", 8));
Data.Add(new ElectionData("Louisiana", "Romney", 8));
Data.Add(new ElectionData("Maine", "Romney", 4));
Data.Add(new ElectionData("Maryland", "Obama", 10));
}
}
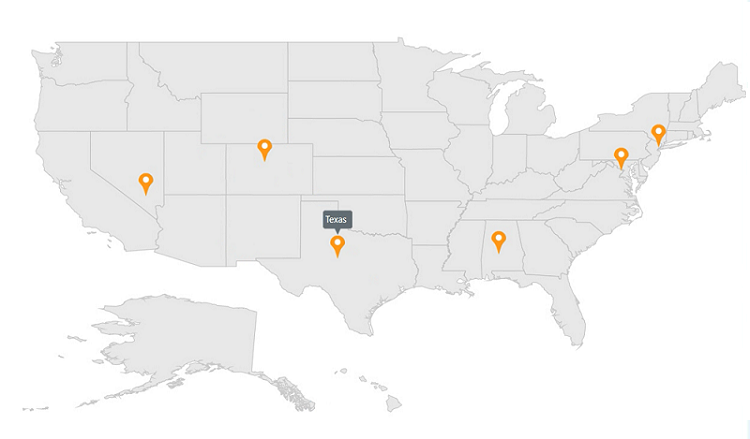
Enable tooltip by tapping the Markers in shapeFileLayer
<maps:SfMap>
        <maps:SfMap.Layers>
            <maps:ShapeFileLayer Uri="MapsZoom.ShapeFiles.usa_state.shp" Markers="{Binding Models}" >
                <maps:ShapeFileLayer.ItemsTemplate>
                    <DataTemplate>
                        <Border >
                            <TextBlock FontFamily="Segoe UI" FontSize="12" Foreground="#FF333333"  Text=""/>
                        </Border>
                    </DataTemplate>
                </maps:ShapeFileLayer.ItemsTemplate>
                <maps:ShapeFileLayer.MarkerToolTipSettings>
                    <maps:ToolTipSetting  ValuePath="Name"></maps:ToolTipSetting>
                </maps:ShapeFileLayer.MarkerToolTipSettings>
                <maps:ShapeFileLayer.MarkerTemplate>
                    <DataTemplate>
                        <Grid Margin="-12,-30,0,0">
                            <Canvas>
                                <Image Source="pin.png" Height="30"/>
                            </Canvas>
                        </Grid>
                    </DataTemplate>
                </maps:ShapeFileLayer.MarkerTemplate>
            </maps:ShapeFileLayer>
        </maps:SfMap.Layers>
    </maps:SfMap>
public class ViewModel
{
public ObservableCollection<Model> Models { get; set; }
public ViewModel()
{
this.Models = new ObservableCollection<Model>();
this.Models.Add(new Model() { Name = "USA ", Latitude = "38.8833N", Longitude = "77.0167W" });
this.Models.Add(new Model() { Name = "Texas ", Latitude = "31.9686N", Longitude = "99.9018W" });
this.Models.Add(new Model() { Name = "Colorado ", Latitude = "39.5501N", Longitude = "105.7821W" });
this.Models.Add(new Model() { Name = "New York ", Latitude = "40.7128N", Longitude = "74.0060W" });
this.Models.Add(new Model() { Name = "Alabama ", Latitude = "32.3182N", Longitude = "86.9023W" });
this.Models.Add(new Model() { Name = "Nevada ", Latitude = "36.8797N", Longitude = " 115.3626W" });
}
}
public class Model
{
public string Name { get; set; }
public string Longitude { get; set; }
public string Latitude { get; set; }
}
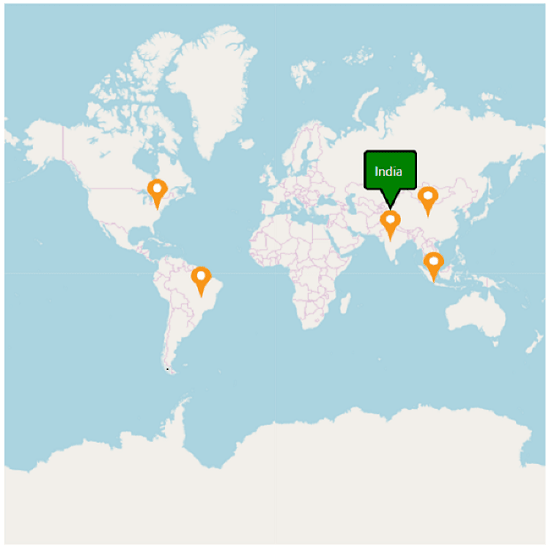
Marker tooltip in imagery layer
<maps:SfMap>
            <maps:SfMap.Layers>
                 <maps:ImageryLayer LayerType="OSM" Markers="{Binding Models}" >
                    <maps:ImageryLayer.MarkerToolTipSettings>
                        <maps:ToolTipSetting ValuePath="Name" PointerLength="18" FontFamily="Segoe UI" FontStyle="Italic" FontSize="20" Foreground="White" Margin="10" Background="Green"  Stroke="Black" StrokeThickness="2" ShowDuration="2000">
                            <maps:ToolTipSetting.ToolTipTemplate>
                                <DataTemplate>
                                    <TextBlock  Foreground="White" Text="{Binding Value}"></TextBlock>
                                </DataTemplate>
                            </maps:ToolTipSetting.ToolTipTemplate>
                        </maps:ToolTipSetting>
                    </maps:ImageryLayer.MarkerToolTipSettings>
                    <maps:ImageryLayer.MarkerTemplate>
                        <DataTemplate>
                            <Grid Margin="-12,-30,0,0">
                                <Canvas>
                                    <Image Source="pin.png" Height="30"/>
                                </Canvas>
                            </Grid>
                        </DataTemplate>
                    </maps:ImageryLayer.MarkerTemplate>
                </maps:ImageryLayer>
            </maps:SfMap.Layers>
        </maps:SfMap>
public class ViewModel
{
public ObservableCollection<Model> Models { get; set; }
public ViewModel()
{
this.Models = new ObservableCollection<Model>();
this.Models.Add(new Model() { Name = "USA ", Latitude = "38.8833N", Longitude = "77.0167W" });
this.Models.Add(new Model() { Name = "Brazil ", Latitude = "15.7833S", Longitude = "47.8667W" });
this.Models.Add(new Model() { Name = "India ", Latitude = "21.0000N", Longitude = "78.0000E" });
this.Models.Add(new Model() { Name = "China ", Latitude = "35.0000N", Longitude = "103.0000E" });
this.Models.Add(new Model() { Name = "Indonesia ", Latitude = "6.1750S", Longitude = "106.8283E" });
}
}
public class Model
{
public string Name { get; set; }
public string Longitude { get; set; }
public string Latitude { get; set; }
}
NOTE
You can refer to our WPF Map feature tour page for its groundbreaking feature representations. You can also explore our WPF Map example to know how to render and configure the map.