Data Marker in WPF Charts (SfChart)
8 Jul 20268 minutes to read
Data Marker is used to mark the data points with built-in available shapes.
Define Data Marker
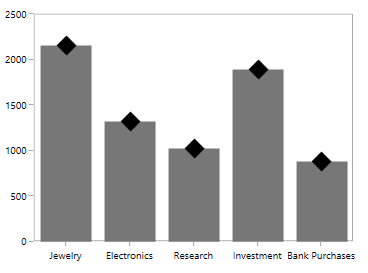
To enable the marker in adornments, you have to set the ShowMarker property to true. By default, no symbol is displayed; you have to add the desired symbol using the Symbol property.
The following code example demonstrates the column series with the Diamond symbol:
<syncfusion:ColumnSeries.AdornmentsInfo>
    <syncfusion:ChartAdornmentInfo
        ShowMarker="True"
        SymbolInterior="Black"
        Symbol="Diamond">
    </syncfusion:ChartAdornmentInfo>
</syncfusion:ColumnSeries.AdornmentsInfo>
ChartAdornmentInfo adornmentInfo = new ChartAdornmentInfo()
{
ShowMarker = true,
Symbol = ChartSymbol.Diamond,
SymbolInterior = new SolidColorBrush(Colors.Black)
};
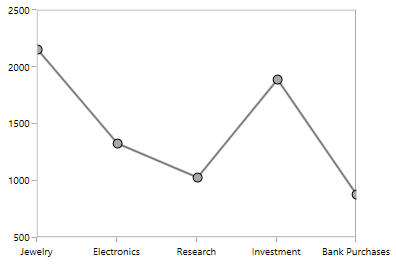
Customizing Symbol
SfChart provides more customization support for symbols in adornments.
-
SymbolHeight- Used to change the height of the symbol. -
SymbolWidth- Used to change the width of the symbol. -
SymbolInterior- Used to change the color of the symbol. -
SymbolStroke- Used to change the stroke color of the symbol. -
SymbolTemplate- Used to customize the appearance of the symbol. -
Symbol- Used to change the predefined symbol.
The following are some predefined symbols:
- Cross
- Diamond
- Ellipse
- Hexagon
- HorizontalLine
- InvertedTriangle
- Pentagon
- Plus
- Square
- Triangle
- VerticalLine
<syncfusion:ChartAdornmentInfo
    ShowMarker="True"
    SymbolStroke="Black"
    SymbolHeight="10"
    SymbolWidth="10"
    SymbolInterior="DarkGray"
    Symbol="Ellipse">
</syncfusion:ChartAdornmentInfo>
ChartAdornmentInfo adornmentInfo = new ChartAdornmentInfo()
{
ShowMarker = true,
SymbolStroke = new SolidColorBrush(Colors.Black),
SymbolInterior = new SolidColorBrush(Colors.DarkGray),
SymbolHeight = 10,
SymbolWidth = 10,
Symbol = ChartSymbol.Ellipse
};
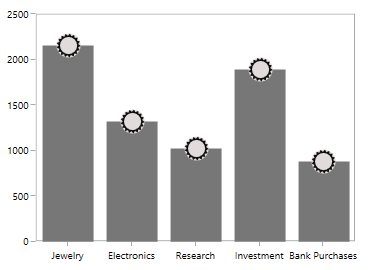
SymbolTemplate
The following code example demonstrates how to use the SymbolTemplate.
<Window.Resources>

    <DataTemplate x:Key="symbolTemplate">
        <Grid>
            <Grid Name="backgroundGrid" Width="24" Height="24" Visibility="Visible">
                <Ellipse Fill="#FFE2DBDB" Name="Fill" Visibility="Visible"/>
            </Grid>
            <Path Stretch="Uniform" Fill="#FF0F0E0E" Width="24" Height="24" Margin="0,0,0,0" RenderTransformOrigin="0.5,0.5">
                <Path.Data>
                    <PathGeometry FillRule="Nonzero" Figures="M23.9296875,10.6165618896484L20.759765625,11.2200794219971 18.09375,
                        13.0306243896484 16.283203125,15.6966400146484 15.6796875,18.8665618896484 16.283203125,
                        22.0423431396484 18.09375,24.7259368896484 20.759765625,26.5540618896484 23.9296875,27.1634368896484 27.1025371551514,
                        26.5540618896484 29.77734375,24.7259368896484 31.5966796875,22.0423431396484 32.203125,18.8665618896484 31.5966796875,
                        15.6966400146484 29.77734375,13.0306243896484 27.1025371551514,11.2200794219971 23.9296875,10.6165618896484z M25.265625,
                        7.35874938964844L26.6953125,9.86656188964844 29.3671875,8.64781188964844 29.765625,11.4837493896484 32.7421875,
                        11.2728118896484 32.015625,14.1790618896484 34.921875,14.9759368896484 33.1875,17.4134368896484 35.578125,
                        19.1478118896484 33.140625,20.7884368896484 34.640625,23.3665618896484 31.8046875,23.9759368896484 32.3203125,
                        26.9759368896484 29.4375,26.5540618896484 28.921875,29.4837493896484 26.25,27.9603118896484 24.75,
                        30.4681243896484 22.8046875,28.2181243896484 20.5078125,30.0228118896484 19.5703125,27.1634368896484 16.640625,
                        28.0306243896484 16.875,25.1009368896484 13.875,24.7728118896484 15.140625,22.1478118896484 12.421875,
                        20.7415618896484 14.5546875,18.6790618896484 12.4921875,16.5228118896484 15.2578125,15.3040618896484 14.203125,
                        12.5384368896484 17.1328125,12.3978118896484 17.1328125,9.42124938964844 19.921875,10.4056243896484 21.046875,
                        7.61656188964844 23.296875,9.49156188964844 25.265625,7.35874938964844z"/>
                </Path.Data>
                <Path.RenderTransform>
                    <TransformGroup>
                        <TransformGroup.Children>
                            <RotateTransform Angle="0"/>
                            <ScaleTransform ScaleX="1"
                            ScaleY="1"/>
                        </TransformGroup.Children>
                    </TransformGroup>
                </Path.RenderTransform>
            </Path>
        </Grid>
    </DataTemplate>
</Window.Resources>

<Grid>
    <chart:SfChart Width="400" Height="300">
    <!-- code omitted for brevity -->
        <syncfusion:ColumnSeries
            Interior="#777777"
            ItemsSource="{Binding Demands}"
            XBindingPath="Category"
            YBindingPath="Value">
            <syncfusion:ColumnSeries.AdornmentsInfo>
                    <syncfusion:ChartAdornmentInfo
                        ShowMarker="True"
                        AdornmentsPosition="Top"
                        SymbolTemplate="{StaticResource symbolTemplate}">
                    </syncfusion:ChartAdornmentInfo>
            </syncfusion:ColumnSeries.AdornmentsInfo>
         </syncfusion:ColumnSeries>
    <!-- code omitted for brevity -->
    </chart:SfChart>
</Grid>
ChartAdornmentInfo adornmentInfo = new ChartAdornmentInfo()
{
AdornmentsPosition = AdornmentsPosition.Top,
SymbolTemplate = chart.Resources["symbolTemplate"] as DataTemplate,
Interior = new SolidColorBrush(Color.FromRgb(0x77, 0x77, 0x77))
};
NOTE
You can refer to our WPF Charts example to know various chart types and how to easily configure them with built-in support for creating stunning visual effects.