How can I help you?
Ticks in WPF Bullet Graph (SfBulletGraph)
18 Oct 20223 minutes to read
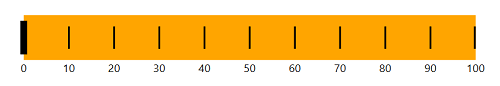
Quantitative scale is displayed with two types of ticks:
- Major ticks, the primary scale indicators.
- Minor ticks, the secondary scale indicators that fall in between the major ticks.
Customizing Ticks
The Interval property is used to calculate the Major tick count for a SfBulletGraph. Like ticks, small ticks are calculated using the MinorTicksPerInterval property.
The stroke of the major and minor ticks is customized by setting the MajorTickStroke and MinorTickStroke properties. The size can be modified by using the MajorTickSize and MinorTickSize properties. By setting MajorTickStrokeThickness and MinorTickStrokeThickness, the stroke’s thickness can be customized.
<syncfusion:SfBulletGraph  Interval="2" Minimum="0" Maximum="10"
                                MinorTicksPerInterval="3"
                                MajorTickSize="15"
                                MinorTickSize="10"
                                MajorTickStroke="Red"
                                MinorTickStroke="Green">
</syncfusion:SfBulletGraph>bulletgraph.Minimum = 0;
bulletgraph.Maximum = 10;
bulletgraph.MinorTicksPerInterval = 3;
bulletgraph.MajorTickSize = 15;
bulletgraph.MinorTickSize = 10;
bulletgraph.MajorTickStroke = new SolidColorBrush(Colors.Red);
bulletgraph.MinorTickStroke = new SolidColorBrush(Colors.Green);
grid.Children.Add(bulletgraph);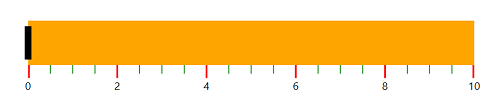
TickPosition
The ticks in the scale can be placed above or below the ranges of the quantitative scale by choosing the options available in the TickPosition property.
They are:
- Below (Default)
- Above
-
Cross
<syncfusion:SfBulletGraph   TickPosition="Cross">
    </syncfusion:SfBulletGraph>
SfBulletGraph bulletgraph = new SfBulletGraph(); bulletgraph.TickPosition = BulletGraphTicksPosition.Cross; grid.Children.Add(bulletgraph);