Getting started with WinUI Chart
This section explains you the steps required to populate the Chart with data, header, add data labels, legend and tooltips to the Chart. This section covers only the minimal features that you need to learn to get started with the Chart.
Creating an application with WinUI Chart
- Create a simple project using the instructions given in the Getting Started with your first WinUI app documentation.
- Add reference to Syncfusion.Chart.WinUI NuGet.
- Import the control namespace
Syncfusion.UI.Xaml.Chartsin XAML or C# to initialize the control. - Initialize SfChart control.
<Page
    x:Class="SfChart_GettingStarted.MainPage"
    xmlns="http://schemas.microsoft.com/winfx/2006/xaml/presentation"
    xmlns:x="http://schemas.microsoft.com/winfx/2006/xaml"
    xmlns:local="using:SfChart_GettingStarted"
    xmlns:d="http://schemas.microsoft.com/expression/blend/2008"
    xmlns:syncfusion="using:Syncfusion.UI.Xaml.Charts"
    xmlns:mc="http://schemas.openxmlformats.org/markup-compatibility/2006"
    mc:Ignorable="d" Height="350" Width="525"
    Background="{ThemeResource ApplicationPageBackgroundThemeBrush}">
    <Grid>
        <syncfusion:SfChart />
    </Grid>
</Page>
using Syncfusion.UI.Xaml.Charts;

namespace SfChart_GettingStarted
{
    public sealed partial class MainPage : Page
    {
        public MainPage()
        {
            InitializeComponent();

            SfChart chart = new SfChart();
            Root_Chart.Children.Add(chart);
        }
    }
}
Initialize chart axis
Chartsupports default axes, so that these axes (PrimaryAxis and SecondaryAxis) will get generated automatically based upon the data bind to the chart.
Axes will be explicitly specified for it’s customization purpose. The initialization of an empty chart with two axes as shown below,
<syncfusion:SfChart>
      <syncfusion:SfChart.PrimaryAxis>
           <syncfusion:CategoryAxis />
      </syncfusion:SfChart.PrimaryAxis>
      <syncfusion:SfChart.SecondaryAxis>
           <syncfusion:NumericalAxis/>
      </syncfusion:SfChart.SecondaryAxis>
</syncfusion:SfChart>
SfChart chart = new SfChart();
CategoryAxis primaryAxis = new CategoryAxis();
chart.PrimaryAxis = primaryAxis;
NumericalAxis secondaryAxis = new NumericalAxis();
chart.SecondaryAxis = secondaryAxis;Run the project and check if you get following output to make sure you have configured your project properly to add chart.
Initialize view model
Now, let us define a simple data model that represents a data point in chart.
public class Person
{
    public string Name { get; set; }

    public double Height { get; set; }
}
Next, create a view model class and initialize a list of Person objects as follows.
public class ViewModel
{
      public List<Person> Data { get; set; }

      public ViewModel()
      {
            Data = new List<Person>()
            {
                new Person { Name = "David", Height = 180 },
                new Person { Name = "Michael", Height = 170 },
                new Person { Name = "Steve", Height = 160 },
                new Person { Name = "Joel", Height = 182 }
            };
       }
 }
Set the ViewModel instance as the DataContext of your window; this is done to bind properties of ViewModel to the chart.
NOTE
Add namespace of
ViewModelclass to your XAML Page if you prefer to setDataContextin XAML.
<Page
    x:Class="SfChart_GettingStarted.MainPage"
    xmlns="http://schemas.microsoft.com/winfx/2006/xaml/presentation"
    xmlns:x="http://schemas.microsoft.com/winfx/2006/xaml"
    xmlns:local="using:SfChart_GettingStarted"
    xmlns:d="http://schemas.microsoft.com/expression/blend/2008"
    xmlns:syncfusion="using:Syncfusion.UI.Xaml.Charts"
    xmlns:mc="http://schemas.openxmlformats.org/markup-compatibility/2006"
    mc:Ignorable="d" Height="350" Width="525"
    Background="{ThemeResource ApplicationPageBackgroundThemeBrush}">

    <Page.DataContext>
        <local:ViewModel></local:ViewModel>
    </Page.DataContext>
</Page>this.DataContext = new ViewModel();Populate chart with data
As we are going to visualize the comparison of heights in the data model, add ColumnSeries to Series property of chart, and then bind the Data property of the above ViewModel to the ColumnSeries.ItemsSource as follows.
NOTE
You need to set XBindingPath and YBindingPath properties, so that chart would fetch values from the respective properties in the data model to plot the series.
<syncfusion:SfChart>
    <syncfusion:SfChart.PrimaryAxis>
        <syncfusion:CategoryAxis Header="Name" />
    </syncfusion:SfChart.PrimaryAxis>
    <syncfusion:SfChart.SecondaryAxis>
        <syncfusion:NumericalAxis Header="Height(in cm)"/>
    </syncfusion:SfChart.SecondaryAxis>
    <syncfusion:ColumnSeries  ItemsSource="{Binding Data}"
                              XBindingPath="Name"
                              YBindingPath="Height">
    </syncfusion:ColumnSeries>

 </syncfusion:SfChart>
SfChart chart = new SfChart();
//Adding horizontal axis to the chart
CategoryAxis primaryAxis = new CategoryAxis();
primaryAxis.Header = "Name";
chart.PrimaryAxis = primaryAxis;
//Adding vertical axis to the chart
NumericalAxis secondaryAxis = new NumericalAxis();
secondaryAxis.Header = "Height(in cm)";
chart.SecondaryAxis = secondaryAxis;
//Initialize the two series for SfChart
ColumnSeries series = new ColumnSeries();
series.ItemsSource = (new ViewModel()).Data;
series.XBindingPath = "Name";
series.YBindingPath = "Height";
//Adding Series to the Chart Series Collection
chart.Series.Add(series);Add title
The header of the chart acts as the title to provide quick information to the user about the data being plotted in the chart. You can set title using the Header property of chart as follows.
<Grid>
   <syncfusion:SfChart Header="Chart">
   </syncfusion:SfChart>
</Grid>
chart.Header = "Chart";Enable data markers
You can add data labels to improve the readability of the chart and it can be enabled using DataMarker property of ChartSeries. By default, there is no label displayed, you have to set ShowLabel property of ChartDataMarker to True.
<syncfusion:SfChart>
	...
  <syncfusion:ColumnSeries >
        <syncfusion:ColumnSeries.DataMarker>
            <syncfusion:ChartDataMarker LabelPosition="Inner" ShowLabel="True" />
        </syncfusion:ColumnSeries.DataMarker>
  </syncfusion:ColumnSeries>
	...
</syncfusion:SfChart>
series.DataMarker = new ChartDataMarker (){ ShowLabel = true };Enable legend
You can enable legend using the Legend property as follows.
<syncfusion:SfChart>
	...
    <syncfusion:SfChart.Legend>
        <syncfusion:ChartLegend/>
    </syncfusion:SfChart.Legend>
    ...
</syncfusion:SfChart>
chart.Legend = new ChartLegend ();Additionally, you need to set label for each series using the Label property of ChartSeries, which will be displayed in corresponding legend.
<syncfusion:SfChart>
	...
      <syncfusion:ColumnSeries Label="Heights" ItemsSource="{Binding Data}" XBindingPath="Name" YBindingPath="Height" />
	...
</syncfusion:SfChart>
ColumnSeries series = new ColumnSeries ();
series.ItemsSource = (new ViewModel()).Data;
series.XBindingPath = "Name";
series.YBindingPath = "Height";
series.Label = "Heights";
Enable tooltip
Tooltips are used to show information about the segment, when you click the segment. You can enable tooltip by setting series ShowTooltip property to true.
<syncfusion:SfChart>
	...
   <syncfusion:ColumnSeries ShowTooltip="True" ItemsSource="{Binding Data}" XBindingPath="Name" YBindingPath="Height"/>
	...
</syncfusion:SfChart>
ColumnSeries series = new ColumnSeries();
series.ItemsSource = (new ViewModel()).Data;
series.XBindingPath = "Name";
series.YBindingPath = "Height";
series.ShowTooltip = true;
The following code example gives you the complete code of above configurations.
<Page
    x:Class="SfChart_GettingStarted.MainPage"
    xmlns="http://schemas.microsoft.com/winfx/2006/xaml/presentation"
    xmlns:x="http://schemas.microsoft.com/winfx/2006/xaml"
    xmlns:local="using:SfChart_GettingStarted"
    xmlns:d="http://schemas.microsoft.com/expression/blend/2008"
    xmlns:syncfusion="using:Syncfusion.UI.Xaml.Charts"
    xmlns:mc="http://schemas.openxmlformats.org/markup-compatibility/2006"
    mc:Ignorable="d" Height="350" Width="525"
    Background="{ThemeResource ApplicationPageBackgroundThemeBrush}">
    <!--Setting DataContext-->
    <Page.DataContext>
        <local:ViewModel></local:ViewModel>
    </Page.DataContext>

    <Grid>
        <syncfusion:SfChart Header="Chart">
            <!--Initialize the horizontal axis for SfChart-->
            <syncfusion:SfChart.PrimaryAxis>
                <syncfusion:CategoryAxis Header="Name" />
            </syncfusion:SfChart.PrimaryAxis>
            <syncfusion:SfChart.SecondaryAxis>
                <syncfusion:NumericalAxis Header="Height(in cm)"/>
            </syncfusion:SfChart.SecondaryAxis>

            <!--Adding Legend to the SfChart-->
            <syncfusion:SfChart.Legend>
                <syncfusion:ChartLegend />
            </syncfusion:SfChart.Legend>

            <!--Initialize the series for SfChart-->
            <syncfusion:ColumnSeries  ItemsSource="{Binding Data}"
                                      XBindingPath="Name"
                                      YBindingPath="Height"
                                      Label="Heights"
                                      ShowTooltip="True">
                   <!--Add data marker to the series-->
                    <syncfusion:ColumnSeries.DataMarker>
                        <syncfusion:ChartDataMarker LabelPosition="Inner" ShowLabel="True" />
                    </syncfusion:ColumnSeries.DataMarker>
            </syncfusion:ColumnSeries>

        </syncfusion:SfChart>
    </Grid>
</Page>
using Syncfusion.UI.Xaml.Charts;
namespace SfChart_GettingStarted
{
public sealed partial class MainPage : Page
{
public MainPage()
{
InitializeComponent();
SfChart chart = new SfChart() { Header = "Chart", Height = 300, Width = 500 };
//Adding horizontal axis to the chart
CategoryAxis primaryAxis = new CategoryAxis();
primaryAxis.Header = "Name";
primaryAxis.FontSize = 14;
chart.PrimaryAxis = primaryAxis;
//Adding vertical axis to the chart
NumericalAxis secondaryAxis = new NumericalAxis();
secondaryAxis.Header = "Height(in cm)";
secondaryAxis.FontSize = 14;
chart.SecondaryAxis = secondaryAxis;
//Adding Legends for the chart
ChartLegend legend = new ChartLegend();
chart.Legend = legend;
//Initializing column series
ColumnSeries series = new ColumnSeries();
series.ItemsSource = (new ViewModel()).Data;
series.XBindingPath = "Name";
series.YBindingPath = "Height";
series.ShowTooltip = true;
series.Label = "Heights";
//Setting data marker to the chart series
series.DataMarker = new ChartDataMarker() { ShowLabel = true };
//Adding Series to the Chart Series Collection
chart.Series.Add(series);
Root_Chart.Children.Add(chart);
}
}
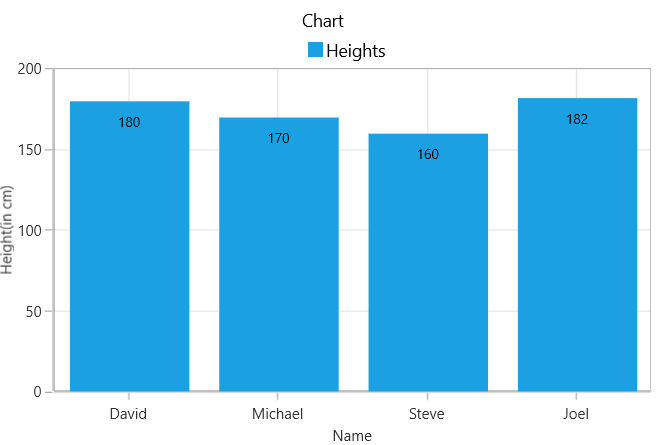
}The following chart is created as a result of the previous codes.
NOTE
Download demo application from GitHub