Radar and Polar in WinUI Chart
27 May 20226 minutes to read
Radar
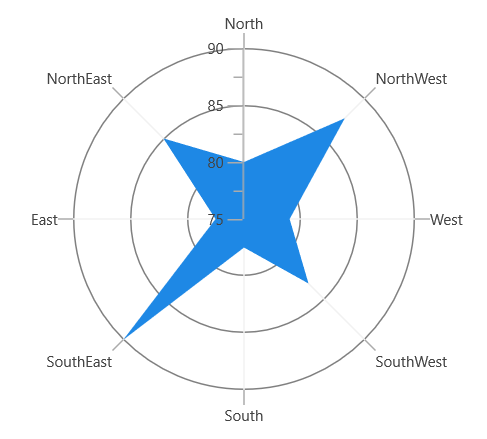
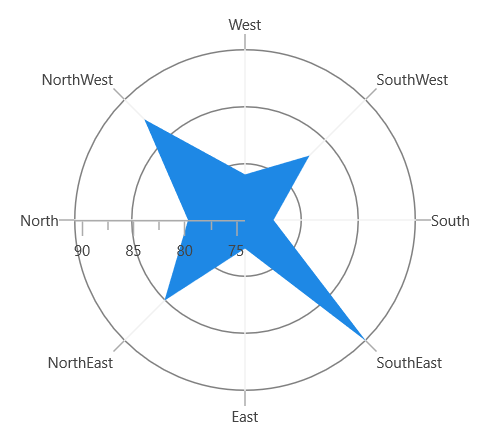
RadarSeries represents a collection of data displayed by quantitative variables represented by axes starting from the same point. The relative position and angle of the axes are not uniform.
The following code example illustrates the use of radar series:
<chart:RadarSeries ItemsSource="{Binding PlantDetails}"

XBindingPath="Direction"

YBindingPath="Tree">

</chart:RadarSeries>
RadarSeries series = new RadarSeries()
{
ItemsSource = new ViewModel().PlantDetails,
XBindingPath = "Direction",
YBindingPath = "Tree",
};
chart.Series.Add(series);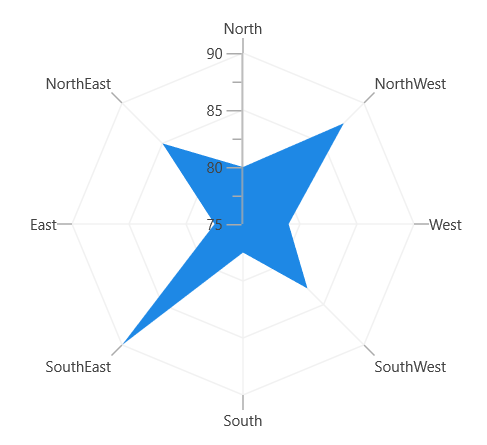
Polar
PolarSeries displays data points that are grouped by category on a 360-degree circle. The following code example shows how to use polar series.
<chart:PolarSeries

ItemsSource="{Binding PlantDetails}"

XBindingPath="Direction"

YBindingPath="Tree" />
PolarSeries series = new PolarSeries()
{
ItemsSource = new ViewModel().PlantDetails,
XBindingPath = "Direction",
YBindingPath = "Tree",
};
chart.Series.Add(series);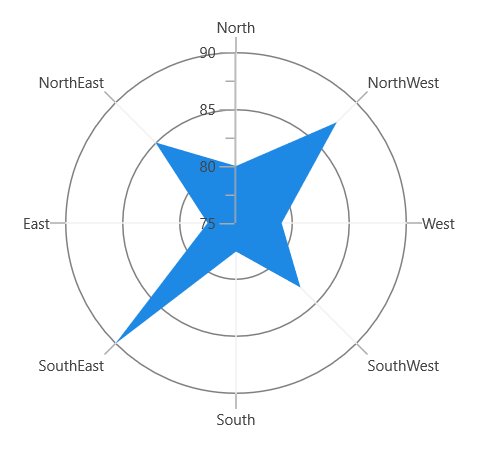
The Radar and Polar charts have the following properties in common:
IsClosed
This property is used to draw the closed path as follows.
<chart:PolarSeries x:Name="series1"

ItemsSource="{Binding PlantDetails}"

Label="Amount Spent" DrawType="Line" IsClosed="False"

XBindingPath="Direction" YBindingPath="Tree"

StrokeThickness="2" />
PolarSeries series = new PolarSeries()
{
ItemsSource = new ViewModel().PlantDetails,
XBindingPath = "Direction",
YBindingPath = "Tree",
IsClosed = false,
DrawType = ChartSeriesDrawType.Line,
Label = "Amount Spent",
StrokeThickness = 2,
};
chart.Series.Add(series);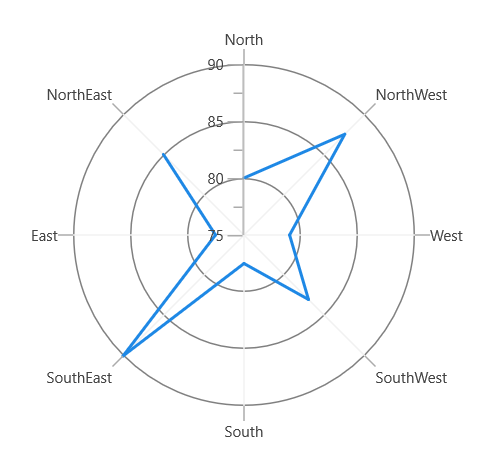
DrawType
This property defines type of curve, whether it is Line or Area.
DrawType as Area
<chart:PolarSeries x:Name="series1"

ItemsSource="{Binding PlantDetails}"

DrawType="Area" IsClosed="True"

XBindingPath="Direction" YBindingPath="Tree" />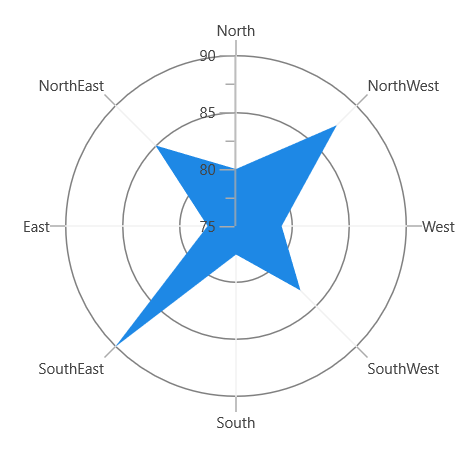
DrawType as Line
<chart:PolarSeries

ItemsSource="{Binding PlantDetails}"

DrawType="Line" IsClosed="True"

XBindingPath="Direction" YBindingPath="Tree"

StrokeThickness="2" />
PolarSeries series = new PolarSeries()
{
ItemsSource = new ViewModel().PlantDetails,
XBindingPath = "Direction",
YBindingPath = "Tree",
IsClosed = True,
DrawType = ChartSeriesDrawType.Line,
StrokeThickness = 2,
};
chart.Series.Add(series);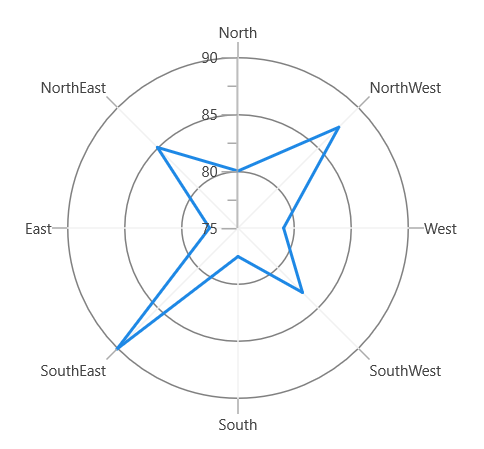
Polar angle
Chart axis provides support to render polar and radar series on 0,90,180 and 270 degrees. It can be achieved by its PolarAngle property. The ‘PolarAngle’ is a type of ‘ChartPolarAngle,’ and its default value is ‘Rotate270.’ Other supported values of ‘PolarAngle’ include ‘Rotate0,’ ‘Rotate90,’ and ‘Rotate180.’ Both the primary and secondary axes can be rotated individually based on their PolarAngle value.
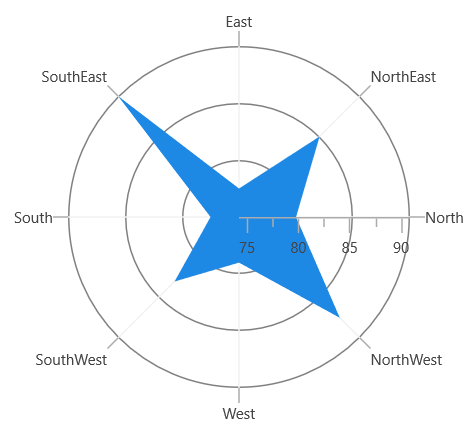
Rotate0
The following sample explains how the axes of the series have been rotated when the PolarAngle value is Rotate0.
<chart:SfChart.PrimaryAxis>

<chart:CategoryAxis PolarAngle="Rotate0"/>

</chart:SfChart.PrimaryAxis>

<chart:SfChart.SecondaryAxis>

<chart:NumericalAxis PolarAngle="Rotate0"/>

</chart:SfChart.SecondaryAxis>chart.PrimaryAxis = new CategoryAxis()
{
PolarAngle = ChartPolarAngle.Rotate0
};
chart.SecondaryAxis = new NumericalAxis()
{
PolarAngle = ChartPolarAngle.Rotate0
};
Rotate90
The following sample explains how the axes of the series have been rotated when the PolarAngle value is Rotate90.
<chart:SfChart.PrimaryAxis>

<chart:CategoryAxis PolarAngle="Rotate90"/>

</chart:SfChart.PrimaryAxis>

<chart:SfChart.SecondaryAxis>

<chart:NumericalAxis PolarAngle="Rotate90"/>

</chart:SfChart.SecondaryAxis>chart.PrimaryAxis = new CategoryAxis()
{
PolarAngle = ChartPolarAngle.Rotate90
};
chart.SecondaryAxis = new NumericalAxis()
{
PolarAngle = ChartPolarAngle.Rotate90
};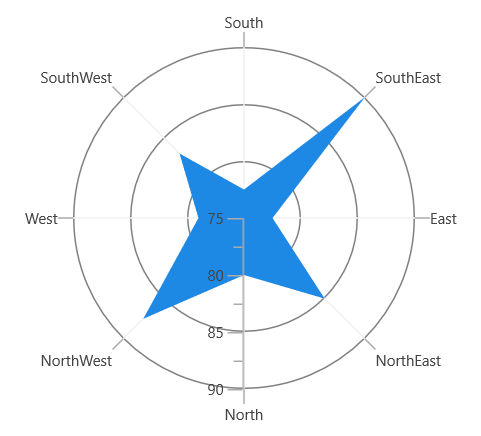
Rotate180
The following sample explains how the axes of the series have been rotated when the PolarAngle value is Rotate180.
<chart:SfChart.PrimaryAxis>

<chart:CategoryAxis PolarAngle="Rotate180"/>

</chart:SfChart.PrimaryAxis>

<chart:SfChart.SecondaryAxis>

<chart:NumericalAxis PolarAngle="Rotate180"/>

</chart:SfChart.SecondaryAxis>chart.PrimaryAxis = new CategoryAxis()
{
PolarAngle = ChartPolarAngle.Rotate180
};
chart.SecondaryAxis = new NumericalAxis()
{
PolarAngle = ChartPolarAngle.Rotate180
};
Rotate270
The following sample explains how the axes of the series have been rotated when the PolarAngle value is Rotate270.
<chart:SfChart.PrimaryAxis>

<chart:CategoryAxis PolarAngle="Rotate270"/>

</chart:SfChart.PrimaryAxis>

<chart:SfChart.SecondaryAxis>

<chart:NumericalAxis PolarAngle="Rotate270"/>

</chart:SfChart.SecondaryAxis>chart.PrimaryAxis = new CategoryAxis()
{
PolarAngle = ChartPolarAngle.Rotate270
};
chart.SecondaryAxis = new NumericalAxis()
{
PolarAngle = ChartPolarAngle.Rotate270
};