Column and Bar in WinUI Chart
31 May 20222 minutes to read
Column
Column charts plot discrete rectangles for the given values. The following code example demonstrates the usage of ColumnSeries.
<chart:ColumnSeries ItemsSource="{Binding Data}" XBindingPath="XValue" YBindingPath="YValue"/>ColumnSeries series = new ColumnSeries()
{
ItemsSource = new ViewModel().Data,
XBindingPath = "XValue",
YBindingPath = "YValue",
};
chart.Series.Add(series);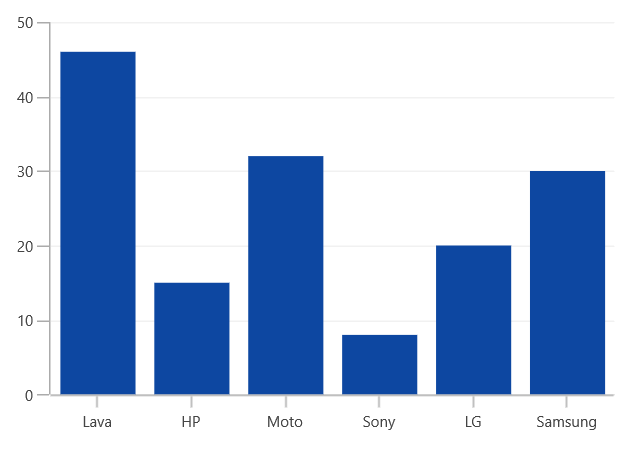
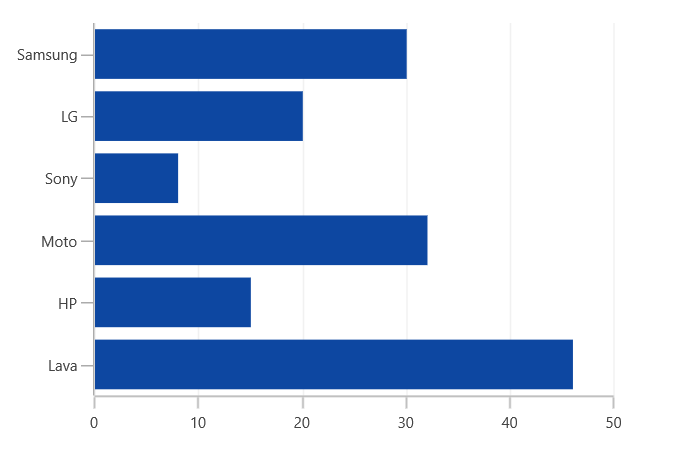
Bar
Bar series is similar to column series, except the orientation. The following code example shows how to use BarSeries.
<chart:BarSeries ItemsSource="{Binding Data}" XBindingPath="XValue" YBindingPath="YValue"/>BarSeries series = new BarSeries()
{
ItemsSource = new ViewModel().Data,
XBindingPath = "XValue",
YBindingPath = "YValue",
};
Spacing
Spacing property of series is used to decide the width of a segment. Spacing value ranges from 0 to 1. The following code illustrates how to set Spacing property of the series.
<Chart:ColumnSeries Chart:ChartSeriesBase.Spacing="0.8"/>ColumnSeries series = new ColumnSeries()
ChartSeriesBase.SetSpacing(series, 0.8);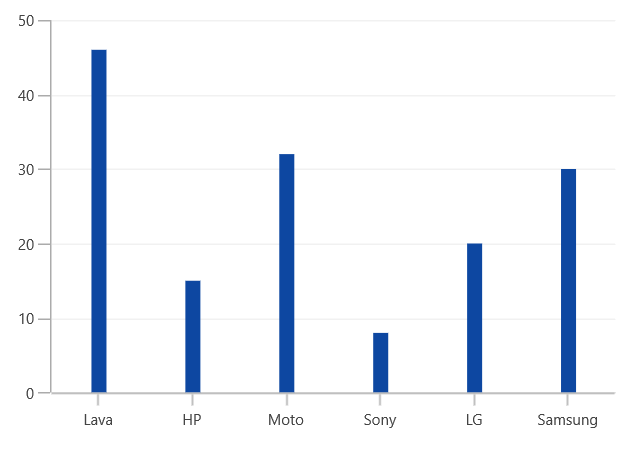
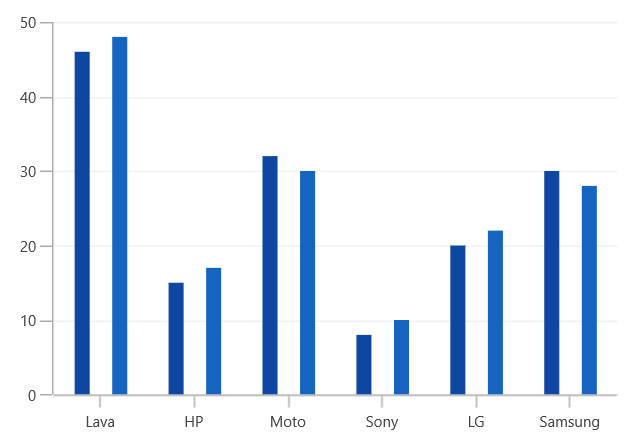
Segment Spacing
The SegmentSpacing property is used to set the spacing between the segments when multiple series are added in chart. Its value ranges from 0 to 1. The following code illustrates how to use the SegmentSpacing property in series.
<Chart:SfChart >

<Chart:ColumnSeries SegmentSpacing="0.6"/>

<Chart:ColumnSeries SegmentSpacing="0.6"/>

</Chart:SfChart>
SfChart chart = new SfChart();
ColumnSeries series1 = new ColumnSeries()
{
SegmentSpacing = 0.6,
};
chart.Series.Add(series1);
ColumnSeries series2 = new ColumnSeries()
{
SegmentSpacing = 0.6
};
chart.Series.Add(series2);