Zooming and Panning in WinUI Chart
24 May 202211 minutes to read
SfChart allows you to zoom the chart area with the help of the zoom feature. This behavior is mostly used to view the data point in a specific area when there are a number of data points inside the chart.
Zooming and panning provides you to take a close-up look of the data point plotted in the series
Adding ZoomPanBehavior to the SfChart
You can create an instance ChartZoomPanBehavior and add it to the Behaviors collection.
<syncfusion:SfChart.Behaviors>

<syncfusion:ChartZoomPanBehavior >

</syncfusion:ChartZoomPanBehavior>

</syncfusion:SfChart.Behaviors>
ChartZoomPanBehavior zooming = new ChartZoomPanBehavior();
chart.Behaviors.Add(zooming);Zooming the ChartArea
Zooming by setting ZoomFactor and ZoomPosition
ZoomFactor defines the percentage of visible range from the total range of axis values. ZoomPosition defines the ranges of values that need to be displayed as a result of ZoomFactor.
The following code example demonstrates how to zoom the chart axis by setting the zoom position and zoom factor.
<syncfusion:SfChart.PrimaryAxis>

<syncfusion:CategoryAxis

ShowGridLines="False"

ZoomFactor="0.3" ZoomPosition="0.1" />

</syncfusion:SfChart.PrimaryAxis>chart.PrimaryAxis = new CategoryAxis()
{
ShowGridLines = false,
ZoomFactor = 0.1,
ZoomPosition = 0.3
};
Mouse Wheel Zooming
Zooming can be performed by mouse wheel action by setting the EnableMouseWheelZooming property to true.
<syncfusion:SfChart.Behaviors>

<syncfusion:ChartZoomPanBehavior EnableMouseWheelZooming="True" >

</syncfusion:ChartZoomPanBehavior>

</syncfusion:SfChart.Behaviors>
ChartZoomPanBehavior zooming = new ChartZoomPanBehavior()
{
EnableMouseWheelZooming = true
};
chart.Behaviors.Add(zooming);Pinch Zooming
If you want to zoom using fingers by touch, set the EnablePinchZooming property to true, as shown in the following code sample.
<syncfusion:SfChart.Behaviors>

<syncfusion:ChartZoomPanBehavior EnablePinchZooming="True" >

</syncfusion:ChartZoomPanBehavior>

</syncfusion:SfChart.Behaviors>
ChartZoomPanBehavior zooming = new ChartZoomPanBehavior()
{
EnablePinchZooming = true
};
chart.Behaviors.Add(zooming);Zooming Relative to Cursor
To enable the zooming relative to cursor position, set the ZoomRelativeToCursor property to true. This support is applicable only for mouse wheel zooming.
<syncfusion:SfChart.Behaviors>

<syncfusion:ChartZoomPanBehavior ZoomRelativeToCursor="True" >

</syncfusion:ChartZoomPanBehavior>

</syncfusion:SfChart.Behaviors>
ChartZoomPanBehavior zooming = new ChartZoomPanBehavior()
{
ZoomRelativeToCursor = true
};
chart.Behaviors.Add(zooming);SelectionZooming
SelectionZooming helps us to zoom a particular area by selecting the region using rectangle. To enable the selection, set theEnableSelectionZooming property to true.
The following code sample demonstrates selection zooming.
<syncfusion:SfChart.Behaviors>

<syncfusion:ChartZoomPanBehavior EnableSelectionZooming="True" >

</syncfusion:ChartZoomPanBehavior>

</syncfusion:SfChart.Behaviors>
ChartZoomPanBehavior zooming = new ChartZoomPanBehavior()
{
EnableSelectionZooming = true
};
chart.Behaviors.Add(zooming);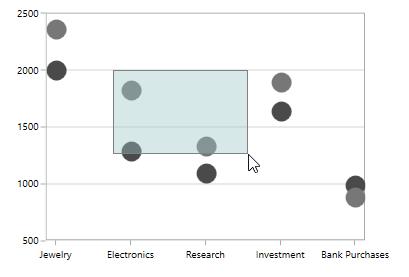
Customization of Selection Rectangle
Selection rectangle can be customized by setting the following properties:
-
Fill- Represents the brush filled in selection rectangle. -
Stroke- Represents the outer line color of selection rectangle. -
StrokeThickness- Represents the selection rectangle outer line thickness.
The following code example demonstrates the customization of selection rectangle
<syncfusion:SfChart.Behaviors>

<syncfusion:ChartZoomPanBehavior EnableSelectionZooming="True"

Fill="LightBlue" Stroke="Blue" StrokeThickness="2" >

</syncfusion:ChartZoomPanBehavior>

</syncfusion:SfChart.Behaviors>
ChartZoomPanBehavior zooming = new ChartZoomPanBehavior()
{
EnableSelectionZooming = true,
Fill = new SolidColorBrush(Colors.LightBlue),
Stroke = new SolidColorBrush(Colors.Blue),
StrokeThickness = 2
};
chart.Behaviors.Add(zooming);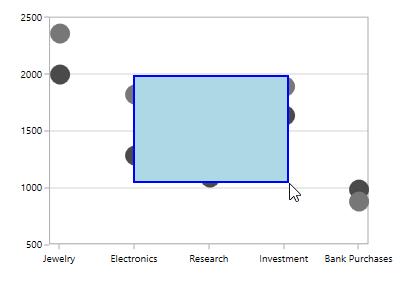
Zooming Mode
The zooming can be done both horizontally and vertically. The zooming direction is defined using the ZoomMode property.
The following code example illustrates how to restrict the chart to be zoomed only along the horizontal axis.
<syncfusion:SfChart.Behaviors>

<syncfusion:ChartZoomPanBehavior ZoomMode="X">

</syncfusion:ChartZoomPanBehavior>

</syncfusion:SfChart.Behaviors>
ChartZoomPanBehavior zooming = new ChartZoomPanBehavior()
{
ZoomMode = ZoomMode.X
};
chart.Behaviors.Add(zooming);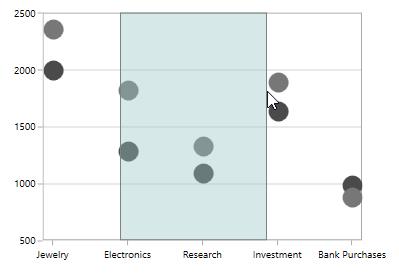
The following code example illustrates how to restrict the chart to be zoomed only along the vertical axis.
<syncfusion:SfChart.Behaviors>

<syncfusion:ChartZoomPanBehavior ZoomMode="Y">

</syncfusion:ChartZoomPanBehavior>

</syncfusion:SfChart.Behaviors>
ChartZoomPanBehavior zooming = new ChartZoomPanBehavior()
{
ZoomMode = ZoomMode.Y
};
chart.Behaviors.Add(zooming);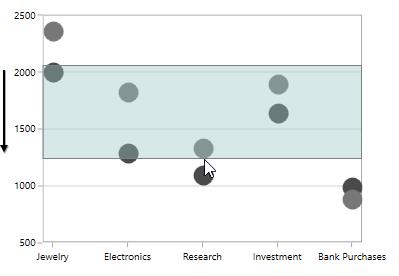
Maximum Zoom Level
You can also limit the zooming by setting the MaximumZoomLevel property, as shown in the following code sample.
<syncfusion:SfChart.Behaviors>

<syncfusion:ChartZoomPanBehavior EnableSelectionZooming="True" MaximumZoomLevel="100">

</syncfusion:ChartZoomPanBehavior>

</syncfusion:SfChart.Behaviors>
ChartZoomPanBehavior zooming = new ChartZoomPanBehavior()
{
EnableSelectionZooming = true,
MaximumZoomLevel = 100
};
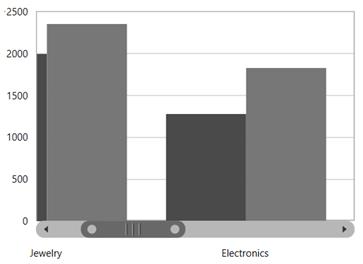
chart.Behaviors.Add(zooming);Panning the ChartArea
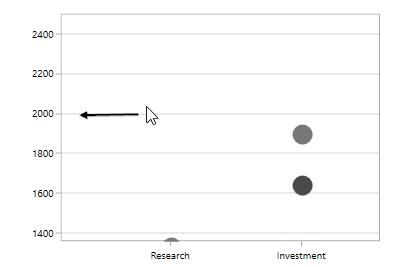
Panning feature allows moving the visible area of the chart when it is zoomed in. To enable panning, set the EnablePanning property to true.
<syncfusion:SfChart.Behaviors>

<syncfusion:ChartZoomPanBehavior EnableMouseWheelZooming="True" EnablePanning="True">

</syncfusion:ChartZoomPanBehavior>

</syncfusion:SfChart.Behaviors>
ChartZoomPanBehavior zooming = new ChartZoomPanBehavior()
{
EnableMouseWheelZooming = true,
EnablePanning = true
};
chart.Behaviors.Add(zooming);The following image demonstrates the cursor panning in the left direction.
Events
The following events are available in SfChart for ChartZoomPanBehavior:
ZoomChanging
The ZoomChanging event occurs when users start zooming the chart. This is a cancelable event. This argument contains the following information:
-
Axis- Gets an instance of the axis whose range is changed by zooming. This event is triggered for each axis in the chart. -
Cancel- Gets or sets a value that indicates whether the zooming should be canceled or not. -
CurrentFactor- Gets the current zoom factor of the axis. -
CurrentPosition- Gets the current zoom position of the axis. -
OldRange- Gets the old visible range of the axis. -
PreviousFactor- Gets the previous zoom factor of the axis. -
PreviousPosition- Gets the previous zoom position of the axis.
ZoomChanged
The ZoomChanged event occurs after the zooming is completed. This argument contains the following information:
-
Axis- Gets an instance of the axis whose range is changed by zooming. This event is triggered for each axis in the chart. -
CurrentFactor- Gets the current zoom factor of the axis. -
CurrentPosition- Gets the current zoom position of the axis. -
OldRange- Gets the old visible range of the axis. -
NewRange- Gets the new visible range of the axis. -
PreviousFactor- Gets the previous zoom factor of the axis. -
PreviousPosition- Gets the previous zoom position of the axis.
SelectionZoomingStart
The SelectionZoomingStart event occurs when users start selection zooming. This argument contains the following information.
-
ZoomRect- Gets the initial bounds of the selected region.
SelectionZoomingEnd
The SelectionZoomingEnd event occurs after selection zooming ends. This argument contains the following information.
-
ZoomRect- Gets the final bounds of the selected region.
SelectionZoomingDelta
The SelectionZoomingDelta event occurs when selecting a region to be zoomed. This is a cancelable event. This argument contains the following information:
-
ZoomRect- Gets the final bounds of the selected region. -
Cancel- Gets or sets a value that indicates whether the selection zooming should be canceled or not.
PanChanging
The PanChanging event occurs when users start panning the chart. This is a cancelable event. This argument contains the following information:
-
Axis- Gets an instance of the axis whose range is changed while panning. This event is triggered for each axis in the chart. -
Cancel- Gets or sets a value that indicates whether the panning should be canceled or not. -
NewZoomPosition- Gets a new zoom position of the axis. -
OldZoomPosition- Gets the old zoom position of the axis.
PanChanged
The PanChanged event occurs when panning is completed. This argument contains the following information:
-
Axis- Gets an instance of the axis whose range is changed while panning. This event is triggered for each axis in the chart. -
NewZoomPosition- Gets a new zoom position of the axis.
ResetZooming
The ResetZooming event occurs when resetting the chart on double tap. This is a cancelable event. This argument contains the following information:
-
Axis- Gets an instance of the axis whose range is changed when panning. This event is triggered for each axis in the chart. -
Cancel- Gets or sets a value that indicates whether the panning should be canceled or not. -
PreviousZoomRange- Gets the previous visible range of the axis.