Data Markers in WinUI Chart
24 May 20221 minute to read
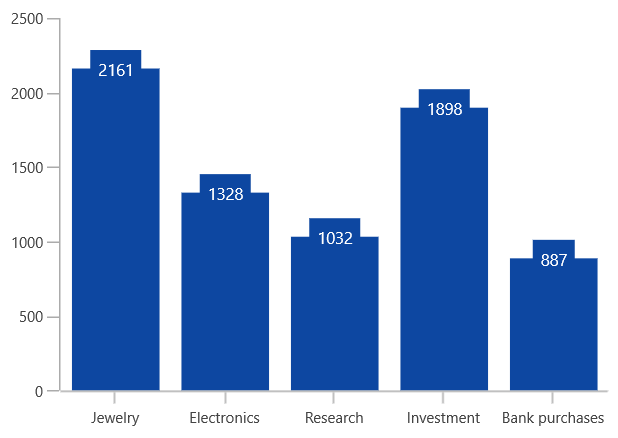
Data markers are used to display values related to a chart segment element. Values from data points (x, y) or other custom properties from a data source can be displayed.
Each data marker can be represented by the following:
- Label - Displays the segment label content at the (X, Y) point.
- Connector Line - Used to connect the (X, Y) point and the label element.
The following code example illustrates how to initialize the data marker.
<chart:SfChart>
. . .
<chart:ColumnSeries ShowDataLabels="True">
    <chart:ColumnSeries.DataLabelSettings>
        <chart:CartesianDataLabelSettings />
    </chart:ColumnSeries.DataLabelSettings>
</chart:ColumnSeries>
</chart:SfChart>
SfChart chart = new SfChart();
ColumnSeries series = new ColumnSeries();
. . .
series.DataLabelSettings = new CartesianDataLabelSettings();
chart.Series.Add(series);