How can I help you?
Grid Lines in WinUI Chart (SfCartesianChart)
2 Jan 20254 minutes to read
Major Grid Lines
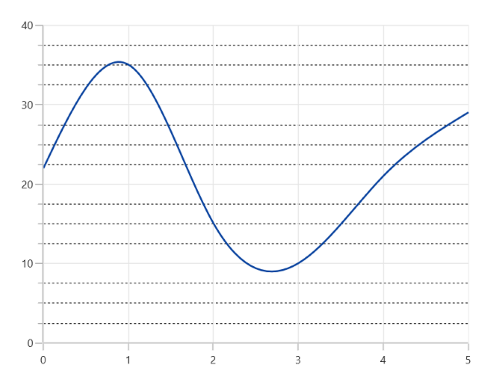
By default, major gridlines are automatically added to the ChartAxis in its defined intervals. The visibility of the gridlines can be controlled using the ShowMajorGridLines property. The default value of ShowMajorGridLines is true.
<chart:SfCartesianChart>

<chart:SfCartesianChart.XAxes>
    <chart:NumericalAxis ShowMajorGridLines="False"/>
</chart:SfCartesianChart.XAxes>

<chart:SfCartesianChart.YAxes>
    <chart:NumericalAxis />
</chart:SfCartesianChart.YAxes>
. . .
</chart:SfCartesianChart>
SfCartesianChart chart = new SfCartesianChart();
. . .
NumericalAxis primaryAxis = new NumericalAxis()
{
ShowMajorGridLines = false
};
chart.XAxes.Add(primaryAxis);
chart.YAxes.Add(new NumericalAxis();
Customization
The MajorGridLineStyle property in the chart axis is used to customize the appearance of major gridlines.
<chart:SfCartesianChart>
. . .
<chart:SfCartesianChart.Resources>
    <Style TargetType="Line" x:Key="lineStyle">
        <Setter Property="StrokeThickness" Value="2"/>
        <Setter Property="Stroke" Value="Black"/>
        <Setter Property="StrokeDashArray" Value="3,3"/>
    </Style>
</chart:SfCartesianChart.Resources>
. . .
<chart:SfCartesianChart.XAxes>
    <chart:NumericalAxis MajorGridLineStyle="{StaticResource lineStyle}"/>
</chart:SfCartesianChart.XAxes>

<chart:SfCartesianChart.YAxes>
    <chart:NumericalAxis />
</chart:SfCartesianChart.YAxes>

</chart:SfCartesianChart>
SfCartesianChart chart = new SfCartesianChart();
. . .
chart.PrimaryAxis = new NumericalAxis()
{
MajorGridLineStyle = chart.Resources["lineStyle"] as Style
};
chart.XAxes.Add(primaryAxis);
chart.YAxes.Add(new NumericalAxis();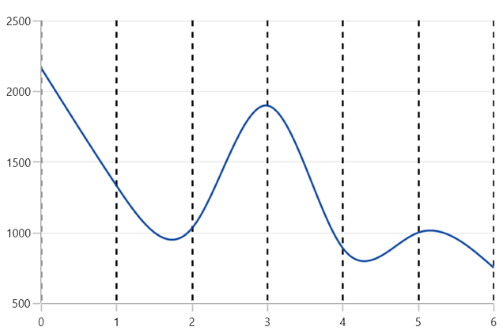
Minor Grid Lines
Minor gridlines will be added automatically when the minor tick lines is defined using the MinorTicksPerInterval property of the chart axis.
<chart:SfCartesianChart>

<chart:SfCartesianChart.XAxes>
    <chart:NumericalAxis/>
</chart:SfCartesianChart.XAxes>

<chart:SfCartesianChart.YAxes>
    <chart:NumericalAxis MinorTicksPerInterval="3" />
</chart:SfCartesianChart.YAxes>
. . .
</chart:SfCartesianChart>
SfCartesianChart chart = new SfCartesianChart();
chart.XAxes.Add(new NumericalAxis();
NumericalAxis secondaryAxis = new NumericalAxis()
{
MinorTicksPerInterval = 3,
};
chart.YAxes.Add(secondaryAxis);
. . .Customization
The MinorGridLineStyle property in the chart axis is used to customize the appearance of minor gridlines.
<chart:SfCartesianChart>
. . .
<chart:SfCartesianChart.Resources>
    <Style TargetType="Line" x:Key="lineStyle">
        <Setter Property="StrokeThickness" Value="0.8"/>
        <Setter Property="Stroke" Value="Black"/>
        <Setter Property="StrokeDashArray" Value="3,3"/>
    </Style>
</chart:SfCartesianChart.Resources>

<chart:SfCartesianChart.XAxes>
    <chart:NumericalAxis/>
</chart:SfCartesianChart.XAxes>

<chart:SfCartesianChart.YAxes>
    <chart:NumericalAxis MinorTicksPerInterval="3"
                         MinorGridLineStyle="{StaticResource lineStyle}"/>
</chart:SfCartesianChart.YAxes>
. . .
</chart:SfCartesianChart>
SfCartesianChart chart = new SfCartesianChart();
chart.XAxes.Add(new NumericalAxis());
NumericalAxis secondaryAxis = new NumericalAxis()
{
MinorTicksPerInterval = 3,
MinorGridLineStyle = chart.Resources["lineStyle"] as Style
};
chart.YAxes.Add(secondaryAxis);
. . .