How can I help you?
Axis Labels in WinUI Chart (SfCartesianChart)
23 Dec 20258 minutes to read
Axis labels are used to show the units, measures, or category value of the axis to visualize the data user friendly. It will be generated based on the range and the values binded to the XBindingPath or YBindingPath properties of series.
Rotation Angle
The LabelRotation property is used to define the angle for the label content.
<chart:SfCartesianChart>
. . .
<chart:SfCartesianChart.XAxes>
    <chart:CategoryAxis LabelRotation="90"/>
</chart:SfCartesianChart.XAxes>

</chart:SfCartesianChart>
SfCartesianChart chart = new SfCartesianChart();
. . .
CategoryAxis primaryAxis = new CategoryAxis()
{
LabelRotation = 90
};
chart.XAxes.Add(primaryAxis);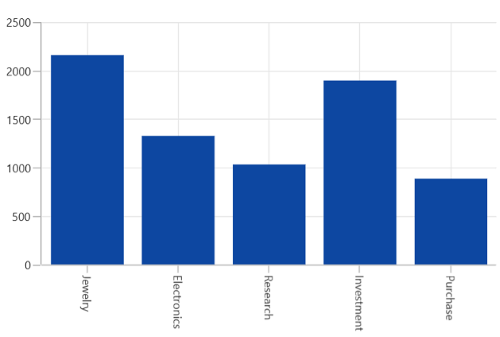
Format
Axis labels can be formatted by predefined formatting types by using the LabelFormat property based on the axis types.
DateTimeAxis
<chart:SfCartesianChart>
. . .
<chart:SfCartesianChart.XAxes>
    <chart:DateTimeAxis>
        <chart:DateTimeAxis.LabelStyle>
            <chart:LabelStyle LabelFormat="MMM-yy" />
        </chart:DateTimeAxis.LabelStyle>
    </chart:DateTimeAxis>
</chart:SfCartesianChart.XAxes>

</chart:SfCartesianChart>
SfCartesianChart chart = new SfCartesianChart();
. . .
DateTimeAxis primaryAxis = new DateTimeAxis()
{
LabelStyle = new LabelStyle() { LabelFormat= "MMM-yy" }
};
chart.XAxes.Add(primaryAxis);NumericalAxis
<chart:SfCartesianChart>
. . .
<chart:SfCartesianChart.YAxes>
    <chart:NumericalAxis>
        <chart:NumericalAxis.LabelStyle>
            <chart:LabelStyle LabelFormat="0.00" />
        </chart:NumericalAxis.LabelStyle>
    </chart:NumericalAxis>
</chart:SfCartesianChart.YAxes>

</chart:SfCartesianChart>
SfCartesianChart chart = new SfCartesianChart();
. . .
NumericalAxis secondaryAxis = new NumericalAxis()
{
LabelStyle = new LabelStyle() { LabelFormat= "0.00" }
};
chart.YAxes.Add(secondaryAxis);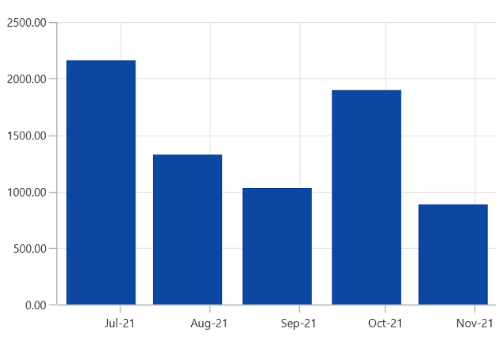
Template
The appearance of the axis labels can be customized by using the LabelTemplate property of axis.
<chart:SfCartesianChart>
. . .
<chart:SfCartesianChart.Resources>
    <DataTemplate x:Key="labelTemplate" x:DataType="chart:ChartAxisLabel">
        <Border BorderBrush="Blue"
	        CornerRadius="5"
		BorderThickness="1">
            <TextBlock Text="{Binding Content}"
		       FontSize="12"
		       FontStyle="Italic"
		       FontWeight="Bold"
		       Margin="3"/>
        </Border>
    </DataTemplate>
</chart:SfCartesianChart.Resources>
. . .
<chart:SfCartesianChart.XAxes>
    <chart:CategoryAxis LabelTemplate="{StaticResource labelTemplate}"/>
</chart:SfCartesianChart.XAxes>

</chart:SfCartesianChart>
SfCartesianChart chart = new SfCartesianChart();
. . .
CategoryAxis primaryAxis = new CategoryAxis()
{
LabelTemplate = chart.Resources["labelTemplate"] as DataTemplate
};
chart.XAxes.Add(primaryAxis);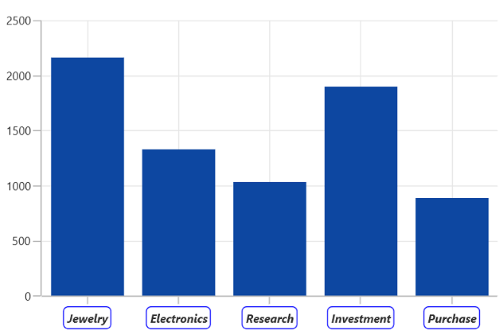
NOTE
The binding context for the
LabelTemplateis ChartAxisLabel, which provides the necessary data for the axis labels.
Label Extent
The LabelExtent property allows to set the distance between the axis header and the axis.
<chart:SfCartesianChart>
. . .
<chart:SfCartesianChart.XAxes>
    <chart:CategoryAxis Header="Demand" LabelExtent="50"/>
</chart:SfCartesianChart.XAxes>

</chart:SfCartesianChart>
SfCartesianChart chart = new SfCartesianChart();
NumericalAxis primaryAxis = new NumericalAxis()
{
Header = "Demand",
LabelExtent = 50
};
chart.XAxes.Add(primaryAxis);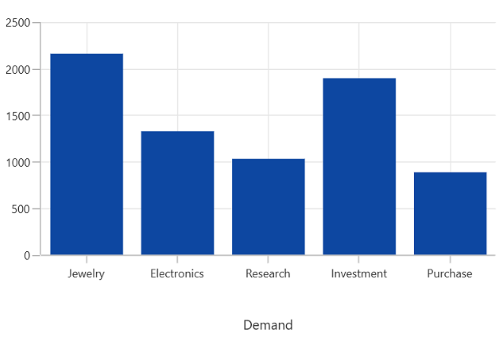
Smart Axis Labels
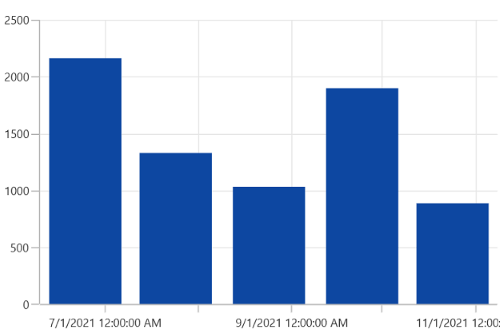
When there are more number of axis labels, they may overlap with each other. Chart axis provides support to handle the overlapping axis labels using the LabelsIntersectAction property. By default the LabelsIntersectAction value is Hide.
| Actions | Description |
|---|---|
| None | Used to display all the label even if it intersects |
| Hide | Used to hide the labels if it intersects |
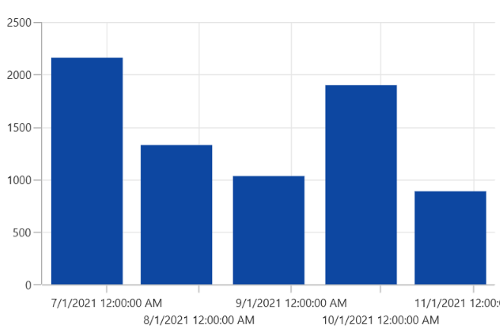
| MultipleRows | Used to move the labels to next row if it intersects |
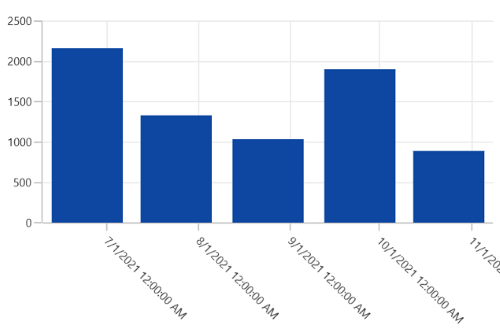
| Auto | Used to rotate the labels if it intersects |
Hide
MultipleRows
Auto
Edge Labels Drawing Mode
Chart axis provides support to customize the rendering position of the edge labels using the EdgeLabelsDrawingMode property. EdgeLabelsDrawingMode property default value is Center.
| Action | Description |
|---|---|
| Center | Positions the label with tick line as center. |
| Fit | Position the gridline inside based on the edge label size |
| Hide | Hides the edge labels. |
| Shift | Shifts the edge labels to the left or right so that it comes inside the chart area. |
<chart:SfCartesianChart>
. . .
<chart:SfCartesianChart.XAxes>
    <chart:DateTimeAxis EdgeLabelsDrawingMode="Shift"/>
</chart:SfCartesianChart.XAxes>

</chart:SfCartesianChart>
SfCartesianChart chart = new SfCartesianChart();
. . .
DateTimeAxis primaryAxis = new DateTimeAxis()
{
EdgeLabelsDrawingMode = EdgeLabelsDrawingMode.Shift
};
chart.XAxes.Add(primaryAxis);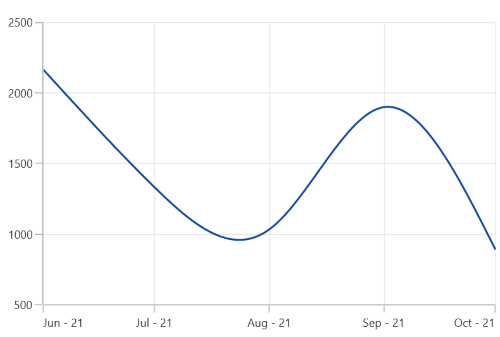
Edge Labels Visibility
The visibility of the edge labels of the axis can be controlled using the EdgeLabelsVisibilityMode property. The default value of EdgeLabelsVisibilityMode is Default, which displays the edge label based on auto interval calculations.
Always Visible
AlwaysVisible option in EdgeLabelsVisibilityMode is used to view the edge labels even in chart area zoomed state.
<chart:SfCartesianChart>
. . .
<chart:SfCartesianChart.XAxes>
    <chart:NumericalAxis EdgeLabelsVisibilityMode="AlwaysVisible"/>
</chart:SfCartesianChart.XAxes>

</chart:SfCartesianChart>
SfCartesianChart chart = new SfCartesianChart();
. . .
NumericalAxis primaryAxis = new NumericalAxis()
{
EdgeLabelsVisibilityMode = EdgeLabelsVisibilityMode.AlwaysVisible
};
chart.XAxes.Add(primaryAxis);Visible
Visible option is used to display the edge labels irrespective of the auto interval calculation until zooming (i.e., in normal state).
<chart:SfCartesianChart>
. . .
<chart:SfCartesianChart.XAxes>
    <chart:NumericalAxis EdgeLabelsVisibilityMode="Visible"/>
</chart:SfCartesianChart.XAxes>

</chart:SfCartesianChart>
SfCartesianChart chart = new SfCartesianChart();
. . .
NumericalAxis primaryAxis = new NumericalAxis()
{
EdgeLabelsVisibilityMode = EdgeLabelsVisibilityMode.Visible
};
chart.XAxes.Add(primaryAxis);