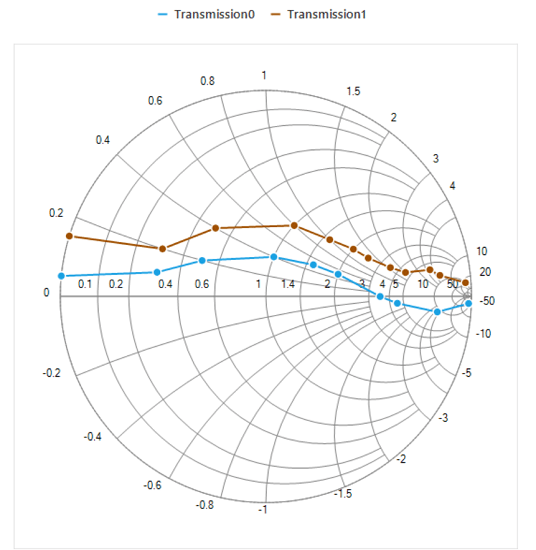
About Syncfusion® Windows Forms Smith Chart Control
18 Nov 20181 minute to read
The Smith chart is one of the most useful data visualization tools for high-frequency circuit applications. It contains two sets of circles to plot the parameters of transmission lines.
The Smith chart provides a perfect way to visualize the data with a high level of user interactivity that focuses on development, productivity, and ease of use.
Key features
- Visualization of the impedance and admittance of transmission lines.
- Representation of data with line series and various types of markers.
- Data label support for better readability.
- Interactive tooltip support.
- Interactive legend.
- Customizable colors.