Assembly deployment
Refer to the control dependencies section to get the list of assemblies or NuGet packages that need to be added as reference to use the control in any application.
For more details on how to install the NuGet packages in a Windows Forms application, refer to the following link:
Getting Started with Windows Forms Smith Chart (SfSmithChart)
10 Jul 202618 minutes to read
This section explains the steps required to build an application with the Smith chart.
Creating a simple Smith chart through the designer
The Smith chart control can be added through the designer by following the below steps.
- Create a new Windows Forms Application.
- Drag and drop the Smith chart control from the toolbox into the designer.
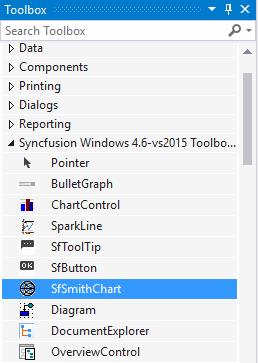
-
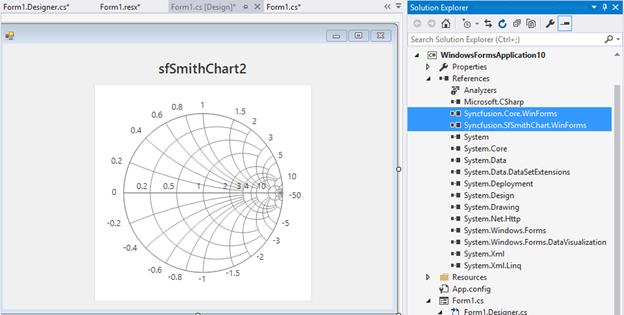
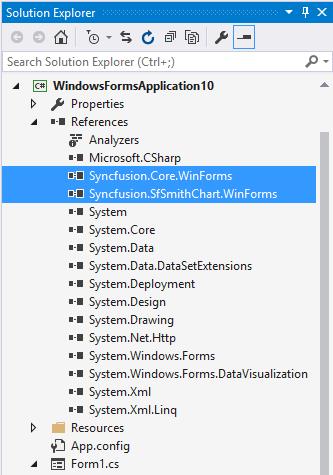
Once you drop the control into the designer page, the Smith chart control will be added successfully along with the required assemblies. The below mentioned assemblies will be added automatically into the application.
- Syncfusion.SfSmithChart.WinForms
- Syncfusion.Core.WinForms
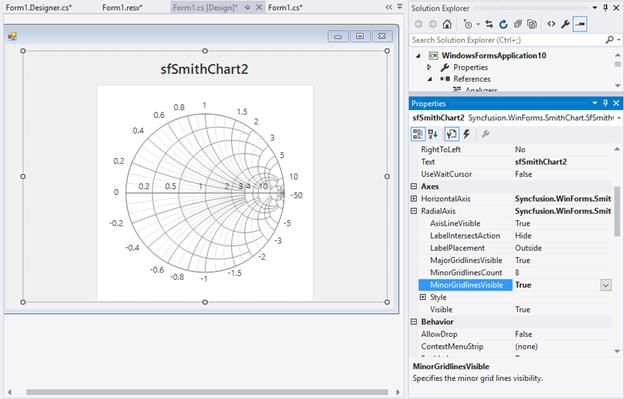
Appearance and behavior related aspects of the Smith chart can be controlled by setting the appropriate properties through the properties grid.
For example, in the below image the MinorGridlinesVisible property of the radial axis is modified via the property grid.
Creating a simple Smith chart through code
The Smith chart control can be added through code behind by following the below steps.
- Create a new Windows Forms Application.
- Add the below assemblies into the project file.
- Syncfusion.SfSmithChart.WinForms
- Syncfusion.Core.WinForms
-
Include the below namespace.
using Syncfusion.WinForms.SmithChart;Imports Syncfusion.WinForms.SmithChart
Populating data
Data points for the Smith chart series can be added in two ways.
- By specifying DataSource.
- By directly adding points in the series.
By specifying DataSource
You can add the data source to the series by using the below properties.
-
DataSource: Used to hold the data source. The data source or data collection can be bound with DataSource. -
ResistanceMember: It is a string property that needs to be bound with resistance axis (or HorizontalAxis). -
ReactanceMember: It is a string property that needs to be bound with reactance axis (or RadialAxis).
public partial class SmithChartSample
{
    public SmithChartSample()
    {
        SmithChartModel model = new SmithChartModel();
        sfSmithChart.BackColor = Color.White;
        series = new LineSeries();
        series.MarkerVisible = true;
        series.TooltipVisible = true;
        series.LegendText = "Transmission";
        series.DataSource = model.Trace1;
        series.ResistanceMember = "Resistance";
        series.ReactanceMember = "Reactance";
        sfSmithChart1.Series.Add(series);
    }
}

public class TransmissionData
{
    public double Resistance { get; set; }
    public double Reactance { get; set; }
}

public class SmithChartModel
{
    public SmithChartModel()
    {
        Trace1 = new ObservableCollection<TransmissionData>();
        Trace1.Add(new TransmissionData() { Resistance = 0, Reactance = 0.05 });
        Trace1.Add(new TransmissionData() { Resistance = 0.3, Reactance = 0.1 });
        Trace1.Add(new TransmissionData() { Resistance = 0.5, Reactance = 0.2 });
        Trace1.Add(new TransmissionData() { Resistance = 1.0, Reactance = 0.4 });
        Trace1.Add(new TransmissionData() { Resistance = 1.5, Reactance = 0.5 });
        Trace1.Add(new TransmissionData() { Resistance = 2.0, Reactance = 0.5 });
        Trace1.Add(new TransmissionData() { Resistance = 2.5, Reactance = 0.4 });
        Trace1.Add(new TransmissionData() { Resistance = 3.5, Reactance = 0.0 });
        Trace1.Add(new TransmissionData() { Resistance = 4.5, Reactance = -0.5 });
        Trace1.Add(new TransmissionData() { Resistance = 5, Reactance = -1.0 });
        Trace1.Add(new TransmissionData() { Resistance = 6, Reactance = -1.5 });
        Trace1.Add(new TransmissionData() { Resistance = 7, Reactance = -2.5 });
        Trace1.Add(new TransmissionData() { Resistance = 8, Reactance = -3.5 });
        Trace1.Add(new TransmissionData() { Resistance = 9, Reactance = -4.5 });
        Trace1.Add(new TransmissionData() { Resistance = 10, Reactance = -10 });
        Trace1.Add(new TransmissionData() { Resistance = 20, Reactance = -50 });
    }

    public ObservableCollection<TransmissionData> Trace1 { get; set; }
}
Public Partial Class SmithChartSample
Public Sub New()
Dim model As SmithChartModel = New SmithChartModel()
sfSmithChart.BackColor = Color.White
series = New LineSeries()
series.MarkerVisible = True
series.TooltipVisible = True
series.LegendText = "Transmission"
series.DataSource = model.Trace1
series.ResistanceMember = "Resistance"
series.ReactanceMember = "Reactance"
sfSmithChart1.Series.Add(series)
End Sub
End Class
Public Class TransmissionData
Public Property Resistance As Double
Public Property Reactance As Double
End Class
Public Class SmithChartModel
Public Sub New()
Trace1 = New ObservableCollection(Of TransmissionData)()
Trace1.Add(New TransmissionData() With { .Resistance = 0, .Reactance = 0.05 })
Trace1.Add(New TransmissionData() With { .Resistance = 0.3, .Reactance = 0.1 })
Trace1.Add(New TransmissionData() With { .Resistance = 0.5, .Reactance = 0.2 })
Trace1.Add(New TransmissionData() With { .Resistance = 1.0, .Reactance = 0.4 })
Trace1.Add(New TransmissionData() With { .Resistance = 1.5, .Reactance = 0.5 })
Trace1.Add(New TransmissionData() With { .Resistance = 2.0, .Reactance = 0.5 })
Trace1.Add(New TransmissionData() With { .Resistance = 2.5, .Reactance = 0.4 })
Trace1.Add(New TransmissionData() With { .Resistance = 3.5, .Reactance = 0.0 })
Trace1.Add(New TransmissionData() With { .Resistance = 4.5, .Reactance = -0.5 })
Trace1.Add(New TransmissionData() With { .Resistance = 5, .Reactance = -1.0 })
Trace1.Add(New TransmissionData() With { .Resistance = 6, .Reactance = -1.5 })
Trace1.Add(New TransmissionData() With { .Resistance = 7, .Reactance = -2.5 })
Trace1.Add(New TransmissionData() With { .Resistance = 8, .Reactance = -3.5 })
Trace1.Add(New TransmissionData() With { .Resistance = 9, .Reactance = -4.5 })
Trace1.Add(New TransmissionData() With { .Resistance = 10, .Reactance = -10 })
Trace1.Add(New TransmissionData() With { .Resistance = 20, .Reactance = -50 })
End Sub
Public Property Trace1 As ObservableCollection(Of TransmissionData)
End ClassBy directly adding points in the series
You can add each point in the series Points collection to render the series.
lineSeries = sfSmithChart.Series[0] as LineSeries;
Random random = new Random();
for (int i = 0; i < 100; i++)
{
    double val = random.Next(0, 5);
    double val1 = random.Next(-5, 5);
    lineSeries.Points.Add(val, val1);
}
lineSeries = TryCast(sfSmithChart.Series(0), LineSeries)
Dim random As Random = New Random()
For i As Integer = 0 To 100 - 1
Dim val As Double = random.[Next](0, 5)
Dim val1 As Double = random.[Next](-5, 5)
lineSeries.Points.Add(val, val1)
NextInitialize the Smith Chart
To initialize the Smith chart and add it to the application, use the below code.
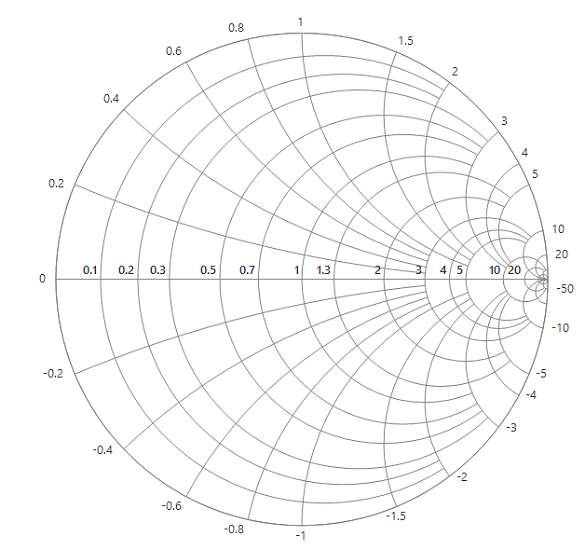
SfSmithChart chart = new SfSmithChart();
this.Controls.Add(chart);
Dim chart As New SfSmithChart()
Me.Controls.Add(chart)As a result of the above steps, the following output will be reproduced.
Adding header to the Smith chart
The Text property of the Smith chart is used to add a title to the Smith chart control.
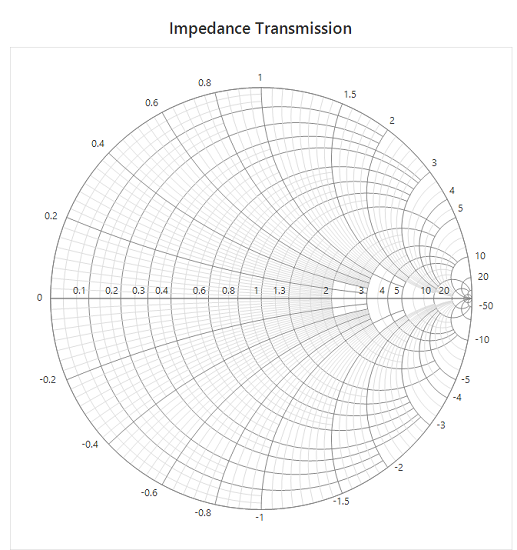
chart.Text = "Impedance Transmission";chart.Text = "Impedance Transmission"Adding Axes
By default, both horizontal and radial axes are added to the Smith chart. As a result, the required customization for the axes can be specified directly instead of initializing and adding the axes to the control. If needed, this can also be done.
The below snippet describes the customization for the axes.
chart.HorizontalAxis.MinorGridlinesVisible = true;
chart.RadialAxis.MinorGridlinesVisible = true;chart.HorizontalAxis.MinorGridlinesVisible = True
chart.RadialAxis.MinorGridlinesVisible = TrueAs a result of adding text and axes to the control, the following output is produced.
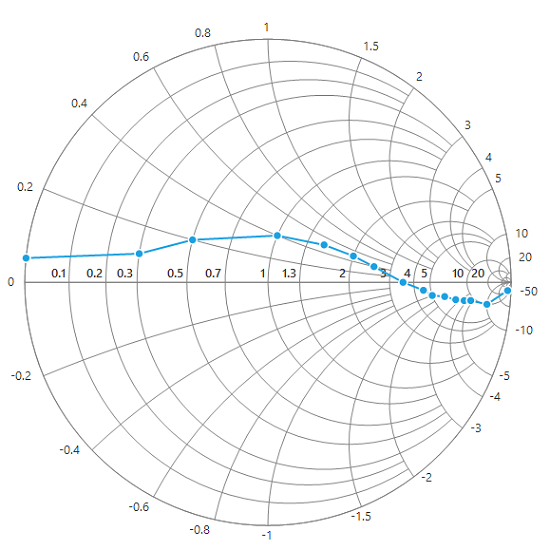
Adding Series
You can plot a line on the Smith chart by adding a line series.
Initialize the series for representing the data. The marker can be made visible using the MarkerVisible property for indicating the data point.
LineSeries series = new LineSeries();Dim series As New LineSeries()Also, specify the DataSource, ResistanceMember, and ReactanceMember properties to populate the data in the Smith chart.
LineSeries series = new LineSeries();
series.MarkerVisible = true;
series.DataSource = model.Trace1;
series.ResistanceMember = "Resistance";
series.ReactanceMember = "Reactance";
chart.Series.Add(series);Dim series As New LineSeries()
series.MarkerVisible = True
series.DataSource = model.Trace1
series.ResistanceMember = "Resistance"
series.ReactanceMember = "Reactance"
chart.Series.Add(series)-
DataSource: Used to hold the data source. The data source or data collection can be bound with DataSource. -
ResistanceMember: It is a string property that needs to be bound with resistance axis (or HorizontalAxis). -
ReactanceMember: It is a string property that needs to be bound with reactance axis (or RadialAxis).
After adding the series, the following output is produced.
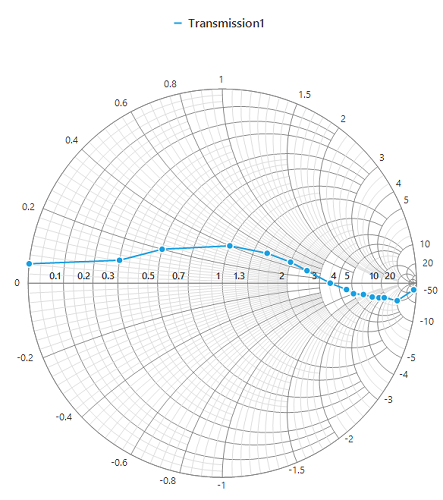
Adding legends to the chart
Legends can be made visible by using the following code.
chart.Legend.Visible = true;chart.Legend.Visible = TrueText for the legend can be described in the series itself using the LegendText property.
series.LegendText = "Transmission1";series.LegendText = "Transmission1"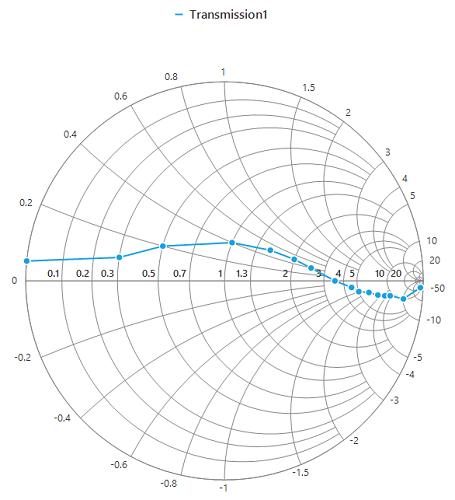
The following code example demonstrates the complete code for creating a Smith chart.
SfSmithChart chart = new SfSmithChart();
chart.Text = "Impedance Transmission";
chart.BackColor = Color.White;
chart.HorizontalAxis.MinorGridlinesVisible = true;
chart.RadialAxis.MinorGridlinesVisible = true;
LineSeries series = new LineSeries();
series.MarkerVisible = true;
series.LegendText = "Transmission1";
series.DataSource = model.Trace1;
series.ResistanceMember = "Resistance";
series.ReactanceMember = "Reactance";
chart.Series.Add(series);
chart.Legend.Visible = true;
chart.Dock = DockStyle.Fill;
this.Controls.Add(chart);Dim chart As New SfSmithChart()
chart.Text = "Impedance Transmission"
chart.BackColor = Color.White
chart.HorizontalAxis.MinorGridlinesVisible = True
chart.RadialAxis.MinorGridlinesVisible = True
Dim series As New LineSeries()
series.MarkerVisible = True
series.LegendText = "Transmission1"
series.DataSource = model.Trace1
series.ResistanceMember = "Resistance"
series.ReactanceMember = "Reactance"
chart.Series.Add(series)
chart.Legend.Visible = True
chart.Dock = DockStyle.Fill
Me.Controls.Add(chart)Now, run the application to produce the following output.