How can I help you?
Data Markers in Windows Forms Smith Chart (SfSmithChart)
17 Feb 20253 minutes to read
Data markers are used to provide information about data point to users. You can add shapes and labels to adorn each data point.
Marker shapes
Shapes can be added to the series to indicate each data point, and it can be enabled by using the MarkerVisible property of series. The MarkerType property provides different shapes such as rectangle, circle, diamond, etc. to indicate the data points.
LineSeries series = new LineSeries();

series.MarkerVisible = true;
Dim series As New LineSeries()
series.MarkerVisible = True
Marker customization
Markers can be customized by using the MarkerBackColor, MarkerBorderColor, MarkerHeight, MarkerWidth, MarkerVisible and MarkerType properties as shown in the following code snippet.
LineSeries series = new LineSeries();
series.MarkerVisible = true;
series.MarkerType = MarkerType.Rectangle;
series.MarkerHeight = 8;
series.MarkerWidth = 8;
series.MarkerBorderColor = Color.Black;
sfSmithChart1.Series.Add(series);
Dim series As New LineSeries()
series.MarkerVisible = True
series.MarkerType = MarkerType.Rectangle
series.MarkerHeight = 8
series.MarkerWidth = 8
series.MarkerBorderColor = Color.Black
sfSmithChart1.Series.Add(series)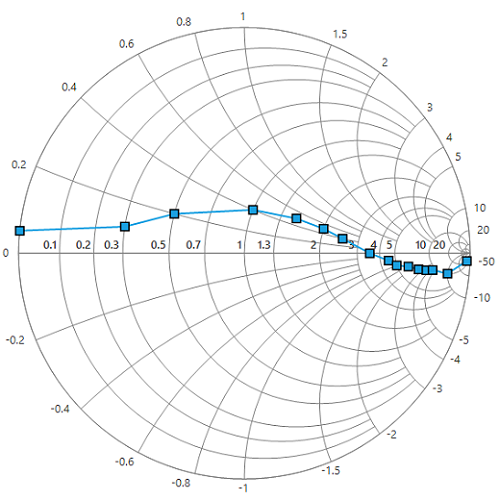
Marker image
Images can also be used as data markers to various shapes. This can be done by setting the MarkerType property to Image and providing the image source for MarkerImage property. Add the required image in the Resources folder of your sample, and refer that image to the MarkerImage property.
series.MarkerType = MarkerType.Image;

series.MarkerWidth = 20;

series.MarkerHeight = 20;

series.MarkerImage = Properties.Resources.Marker;series.MarkerType = MarkerType.Image
series.MarkerWidth = 20
series.MarkerHeight = 20
series.MarkerImage = My.Resources.Marker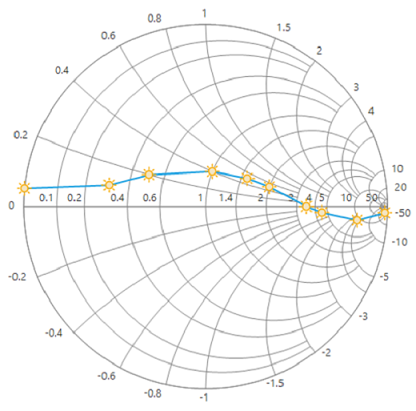
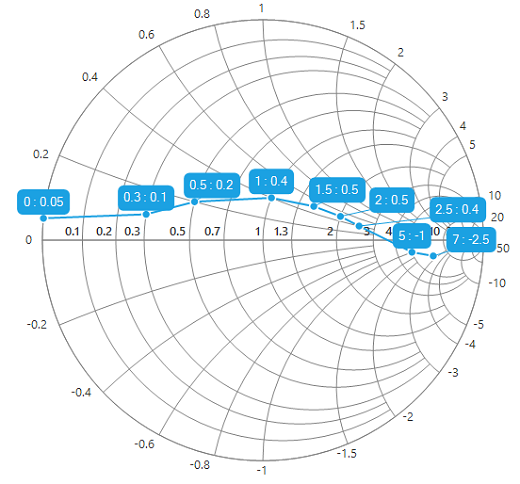
Data labels
Data labels provide additional information about the data point. By default, the data labels are displayed at the top of the data point, and it will be automatically aligned smartly if it collides with the other label.
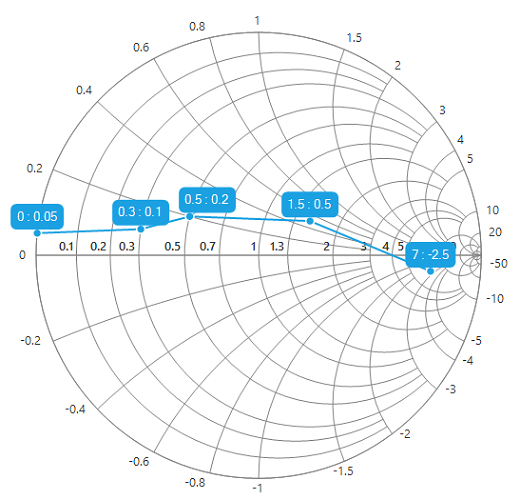
Connector line will be generated automatically if the data label collides with any other label. The following screenshot displays the smart alignment of data labels.