How can I help you?
Axes in Windows Forms Smith Chart (SfSmithChart)
17 Feb 20259 minutes to read
Smith chart supports the following two axes for plotting:
- Horizontal axis
- Radial axis
Horizontal axis
Horizontal axis scale is used to plot the normalized resistance values on impedance Smith chart and normalized conductance values on admittance Smith chart.
The following topics explain the customization of horizontal axis.
Major gridlines customization
Visibility
Major gridlines visibility can be customized using the MajorGridlinesVisible property.
sfSmithChart1.HorizontalAxis.MajorGridlinesVisible = false;sfSmithChart1.HorizontalAxis.MajorGridlinesVisible = False
Style
Major gridlines style can be customized using the properties MajorGridlinesDashStyle, MajorGridlinesColor, MajorGridlinesWidth as you see in the below code snippet.
sfSmithChart1.HorizontalAxis.Style.MajorGridlinesDashStyle = System.Drawing.Drawing2D.DashStyle.Dash;

sfSmithChart1.HorizontalAxis.Style.MajorGridlinesColor = Color.Red;

sfSmithChart1.HorizontalAxis.Style.MajorGridlinesWidth = 1;sfSmithChart1.HorizontalAxis.Style.MajorGridlinesDashStyle = System.Drawing.Drawing2D.DashStyle.Dash
sfSmithChart1.HorizontalAxis.Style.MajorGridlinesColor = Color.Red
sfSmithChart1.HorizontalAxis.Style.MajorGridlinesWidth = 1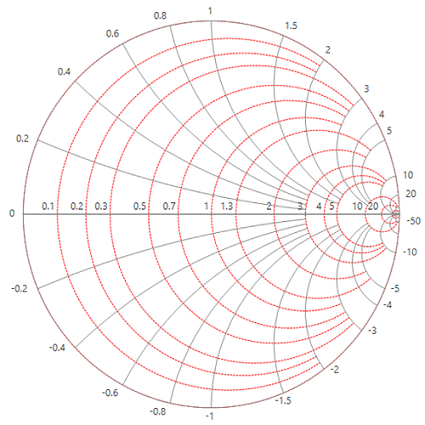
Minor gridlines customization
Visibility
By default, the minor gridlines are not added to axis. The visibility of the minor gridlines can be controlled by using the MinorGridlinesVisible property.
sfSmithChart1.HorizontalAxis.MinorGridlinesVisible = true;sfSmithChart1.HorizontalAxis.MinorGridlinesVisible = True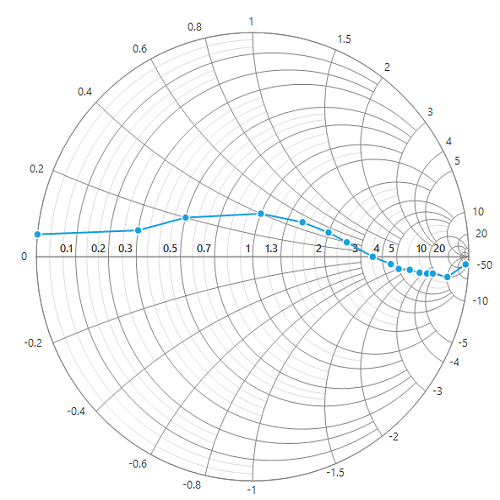
Style
Minor gridlines style can be customized by using the MinorGridlinesDashStyle, MinorGridlinesColor, MinorGridlinesWidth and MinorGridlinesCount properties as shown in the following code snippet.
sfSmithChart1.HorizontalAxis.MinorGridlinesVisible = true;

sfSmithChart1.HorizontalAxis.Style.MinorGridlinesDashStyle = System.Drawing.Drawing2D.DashStyle.Dash;

sfSmithChart1.HorizontalAxis.Style.MinorGridlinesColor = Color.Red;

sfSmithChart1.HorizontalAxis.Style.MinorGridlinesWidth = 1;

sfSmithChart1.HorizontalAxis.MinorGridlinesCount = 10;sfSmithChart1.HorizontalAxis.MinorGridlinesVisible = True
sfSmithChart1.HorizontalAxis.Style.MinorGridlinesDashStyle = System.Drawing.Drawing2D.DashStyle.Dash
sfSmithChart1.HorizontalAxis.Style.MinorGridlinesColor = Color.Red
sfSmithChart1.HorizontalAxis.Style.MinorGridlinesWidth = 1
sfSmithChart1.HorizontalAxis.MinorGridlinesCount = 10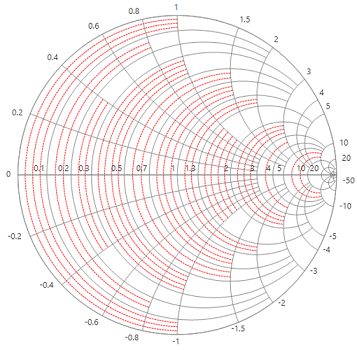
Axis line
To customize the visibility and appearance of an axis line, use the AxisLineVisible, AxisLineDashStyle and AxisLineColor properties.
The following code snippet represents the axis line color customization.
sfSmithChart1.HorizontalAxis.Style.AxisLineColor = Color.Red;sfSmithChart1.HorizontalAxis.Style.AxisLineColor = Color.Red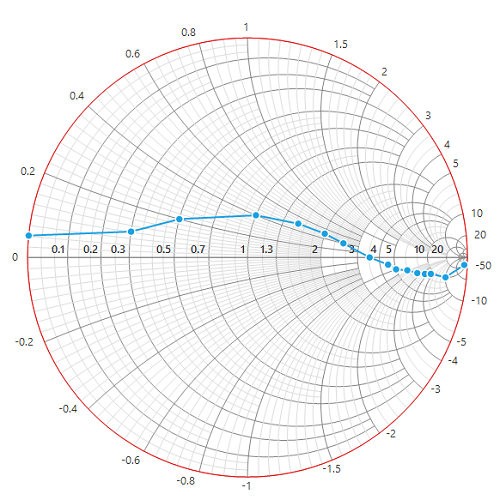
Label Placement
The LabelPlacement property is used to position the axis label either inside or outside of the chart plotting area. By default, the labels are placed outside.
sfSmithChart1.HorizontalAxis.LabelPlacement = LabelPlacement.Inside;sfSmithChart1.HorizontalAxis.LabelPlacement = LabelPlacement.Inside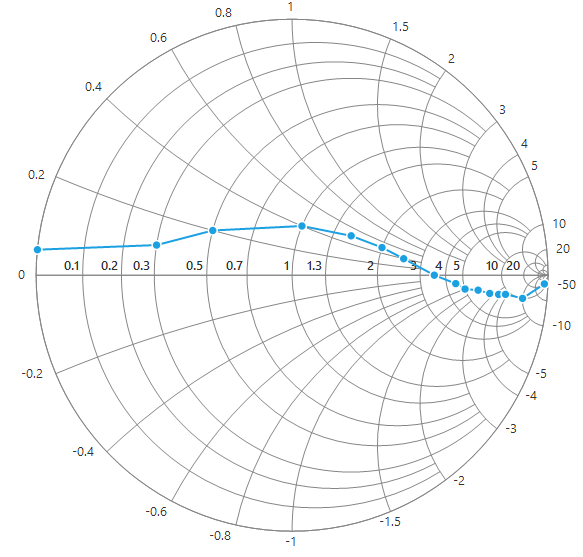
Label intersect action
When the axis labels overlap with each other based on the chart dimensions and label size, you can avoid the overlapping by using the LabelIntersectAction property. The default value of the LabelIntersectAction property is Hide.
sfSmithChart1.HorizontalAxis.LabelIntersectAction = LabelIntersectActions.Hide;sfSmithChart1.HorizontalAxis.LabelIntersectAction = LabelIntersectActions.Hide
Radial Axis
Radial axis scale is used to plot the normalized reactance values in impedance Smith chart and normalized susceptance values in admittance Smith chart.
Major gridlines customization
Visibility
Major gridlines visibility can be customized using the MajorGridlinesVisible property.
sfSmithChart1.RadialAxis.MajorGridlinesVisible = false;sfSmithChart1.RadialAxis.MajorGridlinesVisible = False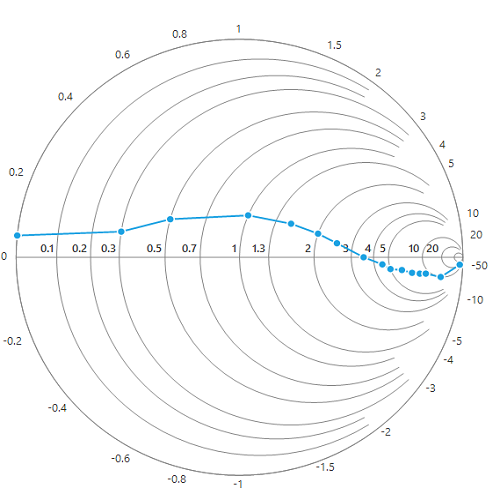
Style
Major gridlines style can be customized using the MajorGridlinesDashStyle, MajorGridlinesColor, MajorGridlinesWidth properties as shown in the following code snippet.
sfSmithChart1.RadialAxis.Style.MajorGridlinesDashStyle = System.Drawing.Drawing2D.DashStyle.Dash;

sfSmithChart1.RadialAxis.Style.MajorGridlinesColor = Color.Red;

sfSmithChart1.RadialAxis.Style.MajorGridlinesWidth = 1;sfSmithChart1.RadialAxis.Style.MajorGridlinesDashStyle = System.Drawing.Drawing2D.DashStyle.Dash
sfSmithChart1.RadialAxis.Style.MajorGridlinesColor = Color.Red
sfSmithChart1.RadialAxis.Style.MajorGridlinesWidth = 1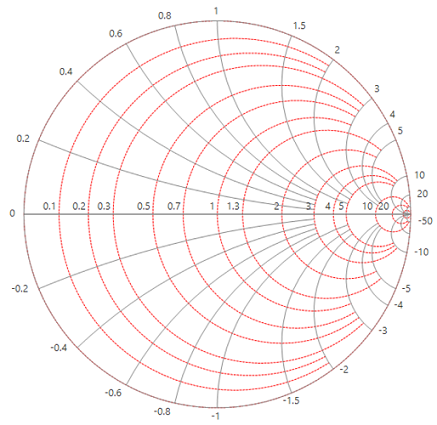
Minor gridlines customization
Visibility
Minor grid lines visibility can be customized using the MinorGridlinesVisible property .
sfSmithChart1.RadialAxis.MinorGridlinesVisible = true;sfSmithChart1.RadialAxis.MinorGridlinesVisible = True
Style
Minor gridlines style can be customized using the MinorGridlinesDashStyle, MinorGridlinesColor, MinorGridlinesWidth and MinorGridlinesCount properties as shown in the following code snippet.
sfSmithChart1.RadialAxis.MinorGridlinesVisible = true;

sfSmithChart1.RadialAxis.Style.MinorGridlinesColor = Color.PaleVioletRed;

sfSmithChart1.RadialAxis.Style.MinorGridlinesDashStyle = System.Drawing.Drawing2D.DashStyle.Dash;

sfSmithChart1.RadialAxis.Style.MinorGridlinesWidth = 1;

sfSmithChart1.RadialAxis.MinorGridlinesCount = 10;sfSmithChart1.RadialAxis.MinorGridlinesVisible = True
sfSmithChart1.RadialAxis.Style.MinorGridlinesColor = Color.PaleVioletRed
sfSmithChart1.RadialAxis.Style.MinorGridlinesDashStyle = System.Drawing.Drawing2D.DashStyle.Dash
sfSmithChart1.RadialAxis.Style.MinorGridlinesWidth = 1
sfSmithChart1.RadialAxis.MinorGridlinesCount = 10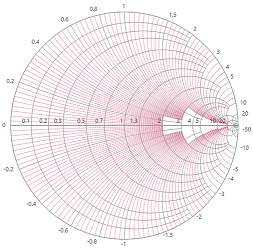
Axis line
To customize the visibility and appearance of an axis line, use the AxisLineVisible, AxisLineDashStyle, AxisLineColor properties.
The following code snippet represents the axis line color customization.
sfSmithChart1.RadialAxis.Style.AxisLineColor = Color.Red;sfSmithChart1.RadialAxis.Style.AxisLineColor = Color.Red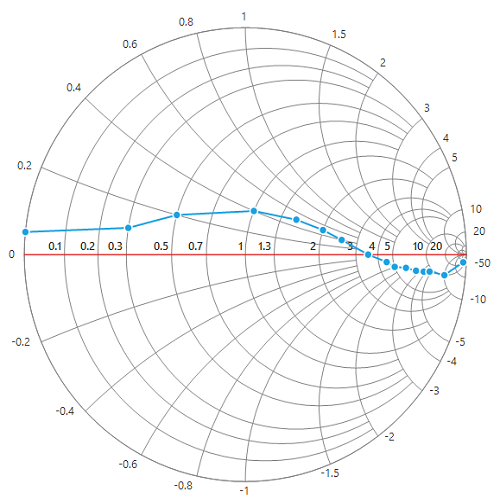
Label Placement
The LabelPlacement property is used to position the axis label either inside or outside of the chart plotting area. By default, the labels are placed outside.
sfSmithChart1.RadialAxis.LabelPlacement = LabelPlacement.Inside;sfSmithChart1.RadialAxis.LabelPlacement = LabelPlacement.Inside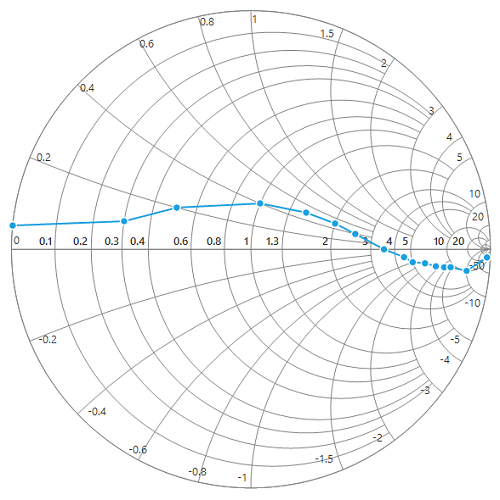
Label intersect action
When the axis labels overlap with each other based on the chart dimensions and label size, you can avoid overlapping by using the LabelIntersectAction property. The default value of the LabelIntersectAction property is Hide.
sfSmithChart1.RadialAxis.LabelIntersectAction = LabelIntersectActions.Hide;sfSmithChart1.RadialAxis.LabelIntersectAction = LabelIntersectActions.Hide
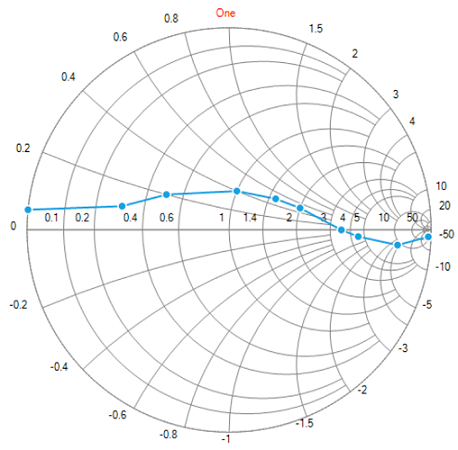
Events
LabelCreated : Occurs when the axis labels are created.
Supports for both the axes.
sfSmithChart1.RadialAxis.LabelCreated += RadialAxis_LabelCreated;

private void RadialAxis_LabelCreated(object sender, EventArgs e)

{

var axisLabel = e as ChartAxisLabelEventArgs;

if (axisLabel.Label.Text == "1")

axisLabel.Label.Text = "One";

}
Private sfSmithChart1.RadialAxis.LabelCreated += RadialAxis_LabelCreated
Private Sub RadialAxis_LabelCreated(ByVal sender As Object, ByVal e As EventArgs)
Dim axisLabel = TryCast(e, ChartAxisLabelEventArgs)
If axisLabel.Label.Text = "1" Then
axisLabel.Label.Text = "One"
End If
End Sub