How can I help you?
Appearance in Windows Forms Smith Chart (SfSmithChart)
17 Feb 20252 minutes to read
Chart palette
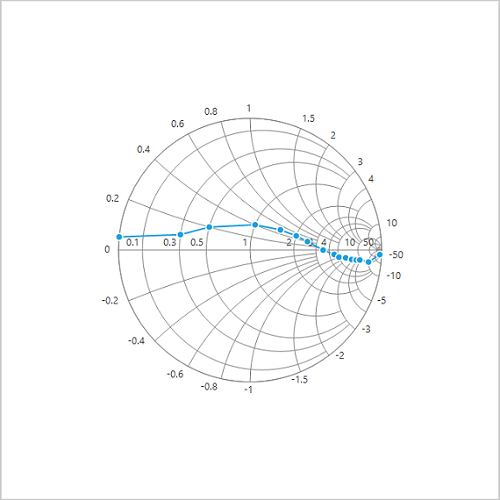
The Smith chart displays different series in different colors by using the Palette property of ColorModel. By default, the Metro palette is applied to the chart.
sfSmithChart1.ColorModel.Palette = ChartColorPalette.Nature;sfSmithChart1.ColorModel.Palette = ChartColorPalette.Nature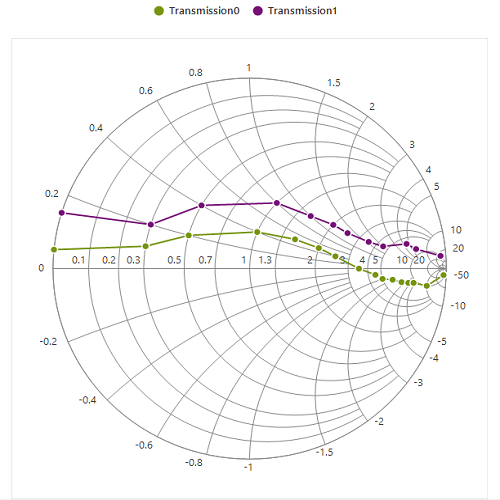
Series palette
The palette color to each data points of specific series can be defined by using Palette property of ColorModel in the Series.
LineSeries series = new LineSeries();

series.ColorModel.Palette = ChartColorPalette.Metro;

series.DataLabel.Visible = true;

sfSmithChart1.Series.Add(series);
Dim series As New LineSeries()
series.ColorModel.Palette = ChartColorPalette.Metro
series.DataLabel.Visible = True
sfSmithChart1.Series.Add(series)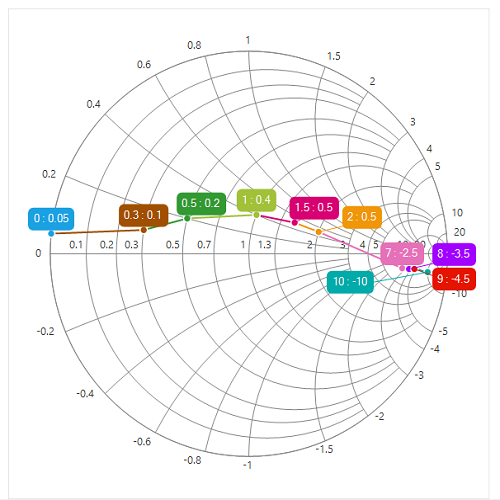
Chart area customization
Chart and chart area (circle plotting area) can be customized by using the BackColor, ChartAreaBorderColor, ChartAreaBackColor, ChartAreaBorderWidth properties in Smith chart.
sfSmithChart1.BackColor = Color.LightSteelBlue;

sfSmithChart1.Style.ChartAreaBorderColor = Color.SkyBlue;

sfSmithChart1.Style.ChartAreaBackColor = Color.AliceBlue;

sfSmithChart1.Style.ChartAreaBorderWidth = 2;sfSmithChart1.BackColor = Color.LightSteelBlue
sfSmithChart1.Style.ChartAreaBorderColor = Color.SkyBlue
sfSmithChart1.Style.ChartAreaBackColor = Color.AliceBlue
sfSmithChart1.Style.ChartAreaBorderWidth = 2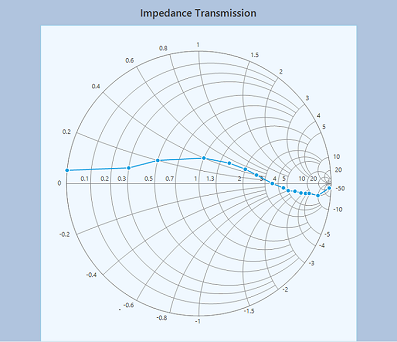
Circle radius
To change the diameter of the Smith chart’s circle with respect to the plot area, use the Radius property. It ranges from 0.1 to 1, and the default value is 0.95.
sfSmithChart1.Radius = 0.6f;sfSmithChart1.Radius = 0.6f