Getting Started with Windows Forms Pivot Chart
13 Jul 202623 minutes to read
Important
Starting with v16.2.0.x, if you refer to Syncfusion® assemblies from trial setup or from the NuGet feed, include a license key in your projects. Refer to this link to learn about registering Syncfusion® license key in your Windows Forms application to use our components.
This section provides an overview for working with the pivot chart for WinForms. Go through the entire process of creating a simple pivot chart.
Assembly deployment
Refer to the control dependencies section to get the list of assemblies or NuGet packages that should be added as reference to use the pivot chart control in any application.
Creating application with pivot chart
This section explains how to add the pivot chart control through the designer, code, and Syncfusion® Reference Manager.
Adding control via designer
The pivot chart control can be added through the designer by following the given steps:
-
Create a new Windows Forms Application in Visual Studio.
-
Drag and drop the pivot chart control from the toolbox into the designer page.
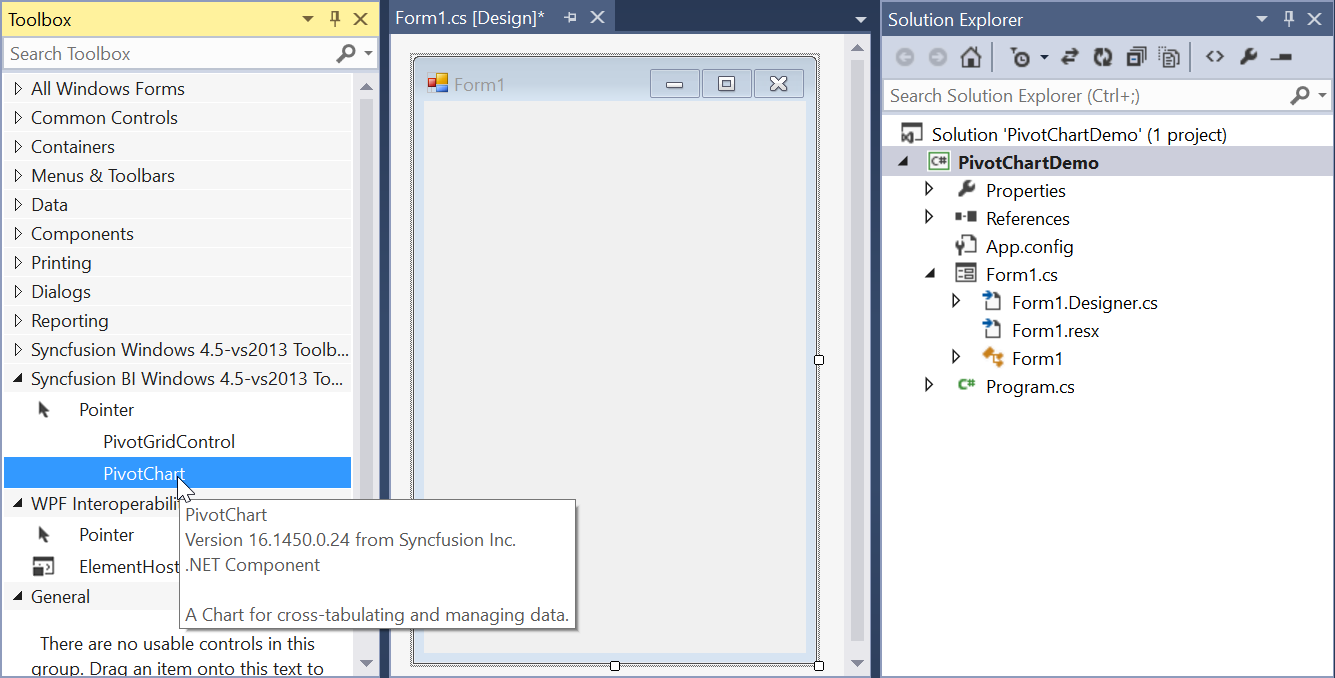
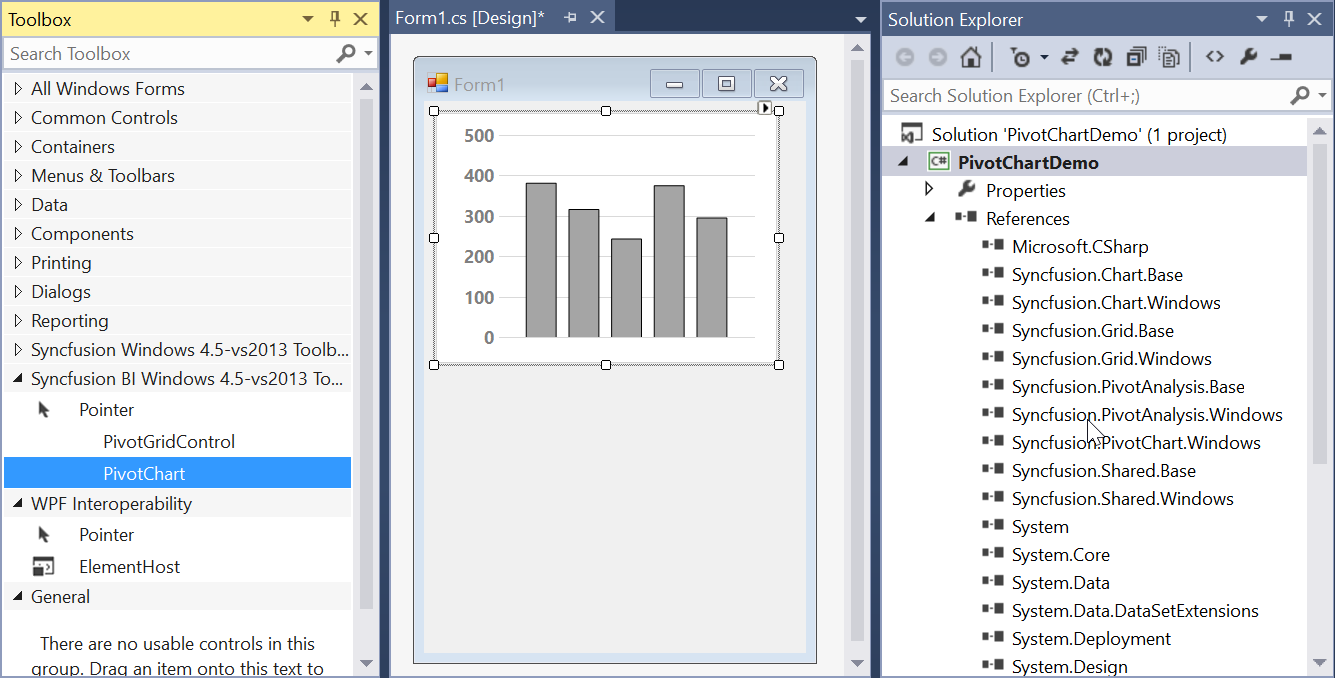
- Then, the pivot chart control will be successfully added to the application along with the required libraries.
Adding control via code
The pivot chart control can be added through the code-behind by following the given steps:
-
Create a new Windows Forms Application in Visual Studio.
-
Add the following assembly references to the project.
- Syncfusion.Chart.Windows.dll
- Syncfusion.Grid.Windows.dll
- Syncfusion.PivotAnalysis.Base.dll
- Syncfusion.PivotAnalysis.Windows.dll
- Syncfusion.PivotChart.Windows.dll
- Syncfusion.Shared.Base.dll
-
Then, initialize the pivot chart control by creating an instance and adding it to the form using the following specified code.
//Initialize a new PivotChart.
Syncfusion.Windows.Forms.PivotChart.PivotChart pivotChart1 = new Syncfusion.Windows.Forms.PivotChart.PivotChart();

//Add the PivotChart control to the parent control.
this.Controls.Add(pivotChart1);
'Initialize a new PivotChart. Dim pivotChart1 As New Syncfusion.Windows.Forms.PivotChart.PivotChart() 'Add the PivotChart control to the parent control. Me.Controls.Add(pivotChart1)
Adding control via Syncfusion® reference manager
Syncfusion® reference manager is a Visual Studio Add-In that helps to add Syncfusion® controls. The pivot chart control can be added through the Syncfusion® Reference Manager by following the given steps:
-
Create a new Windows Forms Application in Visual Studio.
-
Then, right-click the project and select Syncfusion® Reference Manager.
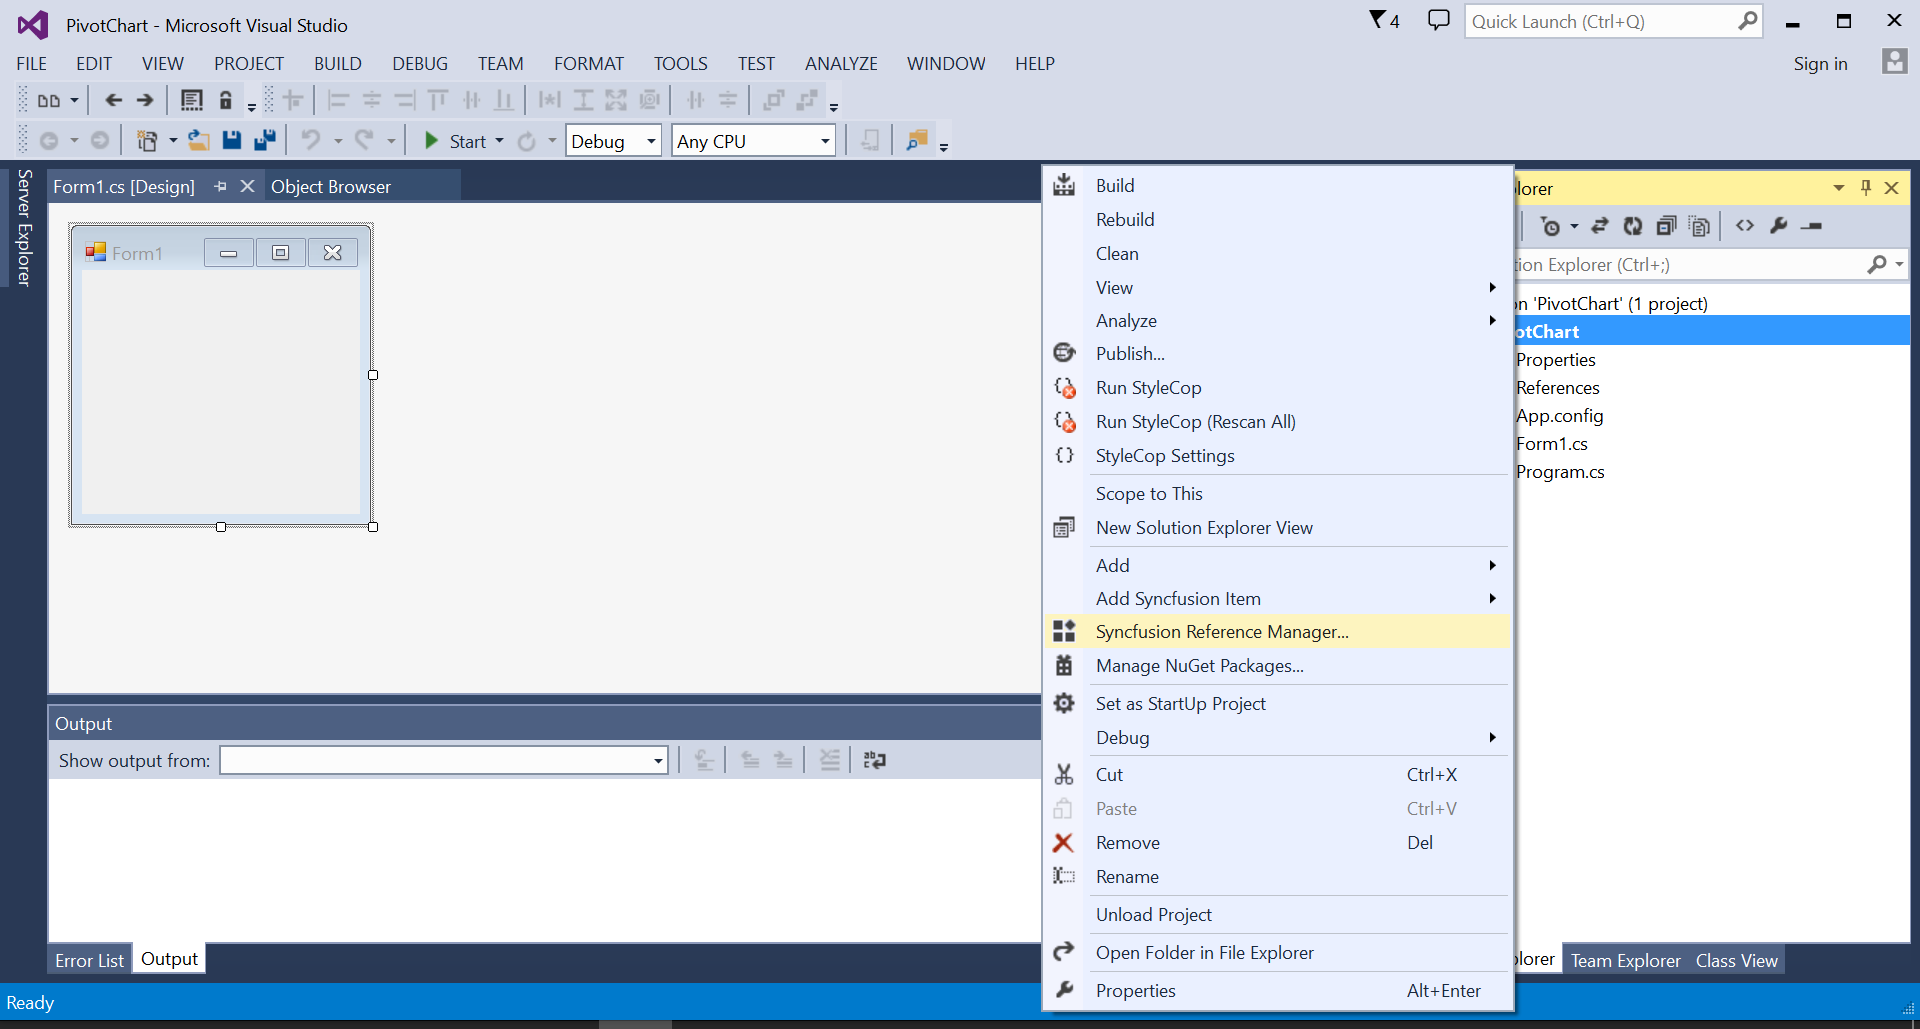
-
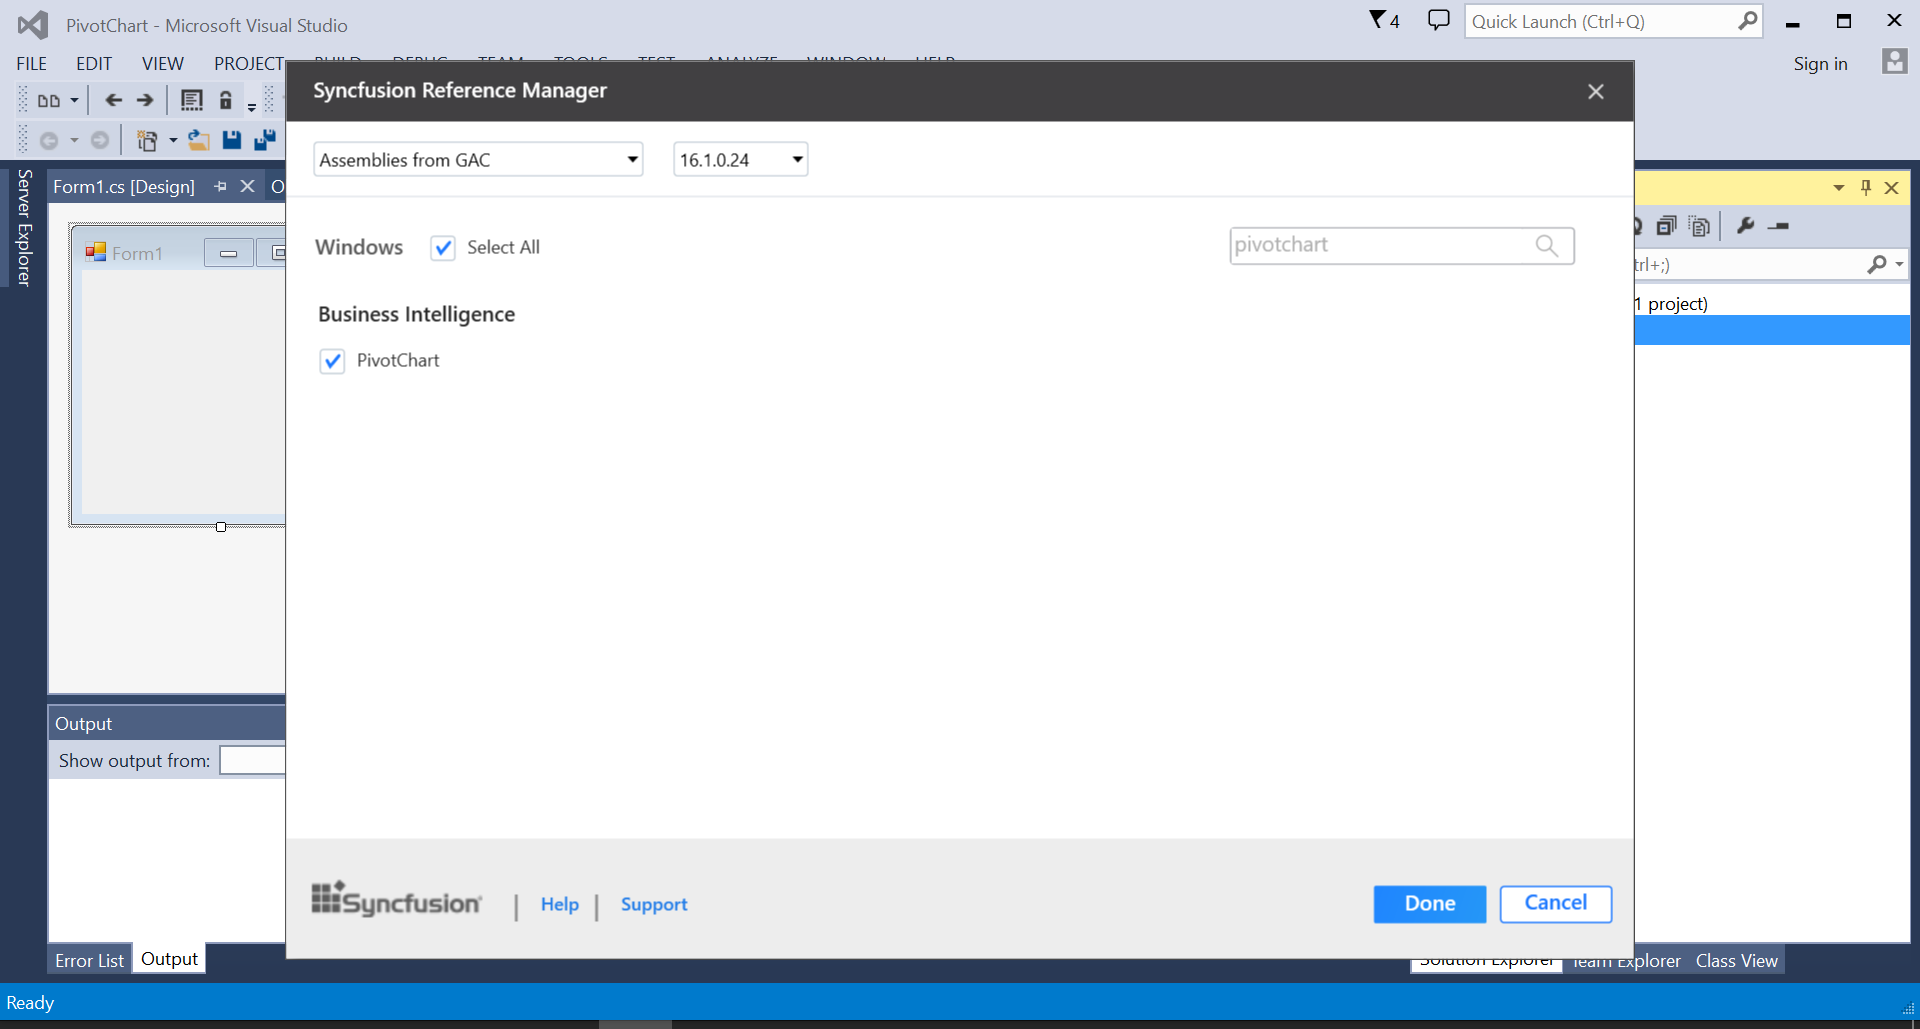
The Syncfusion® Reference Manager wizard will be opened as follows.
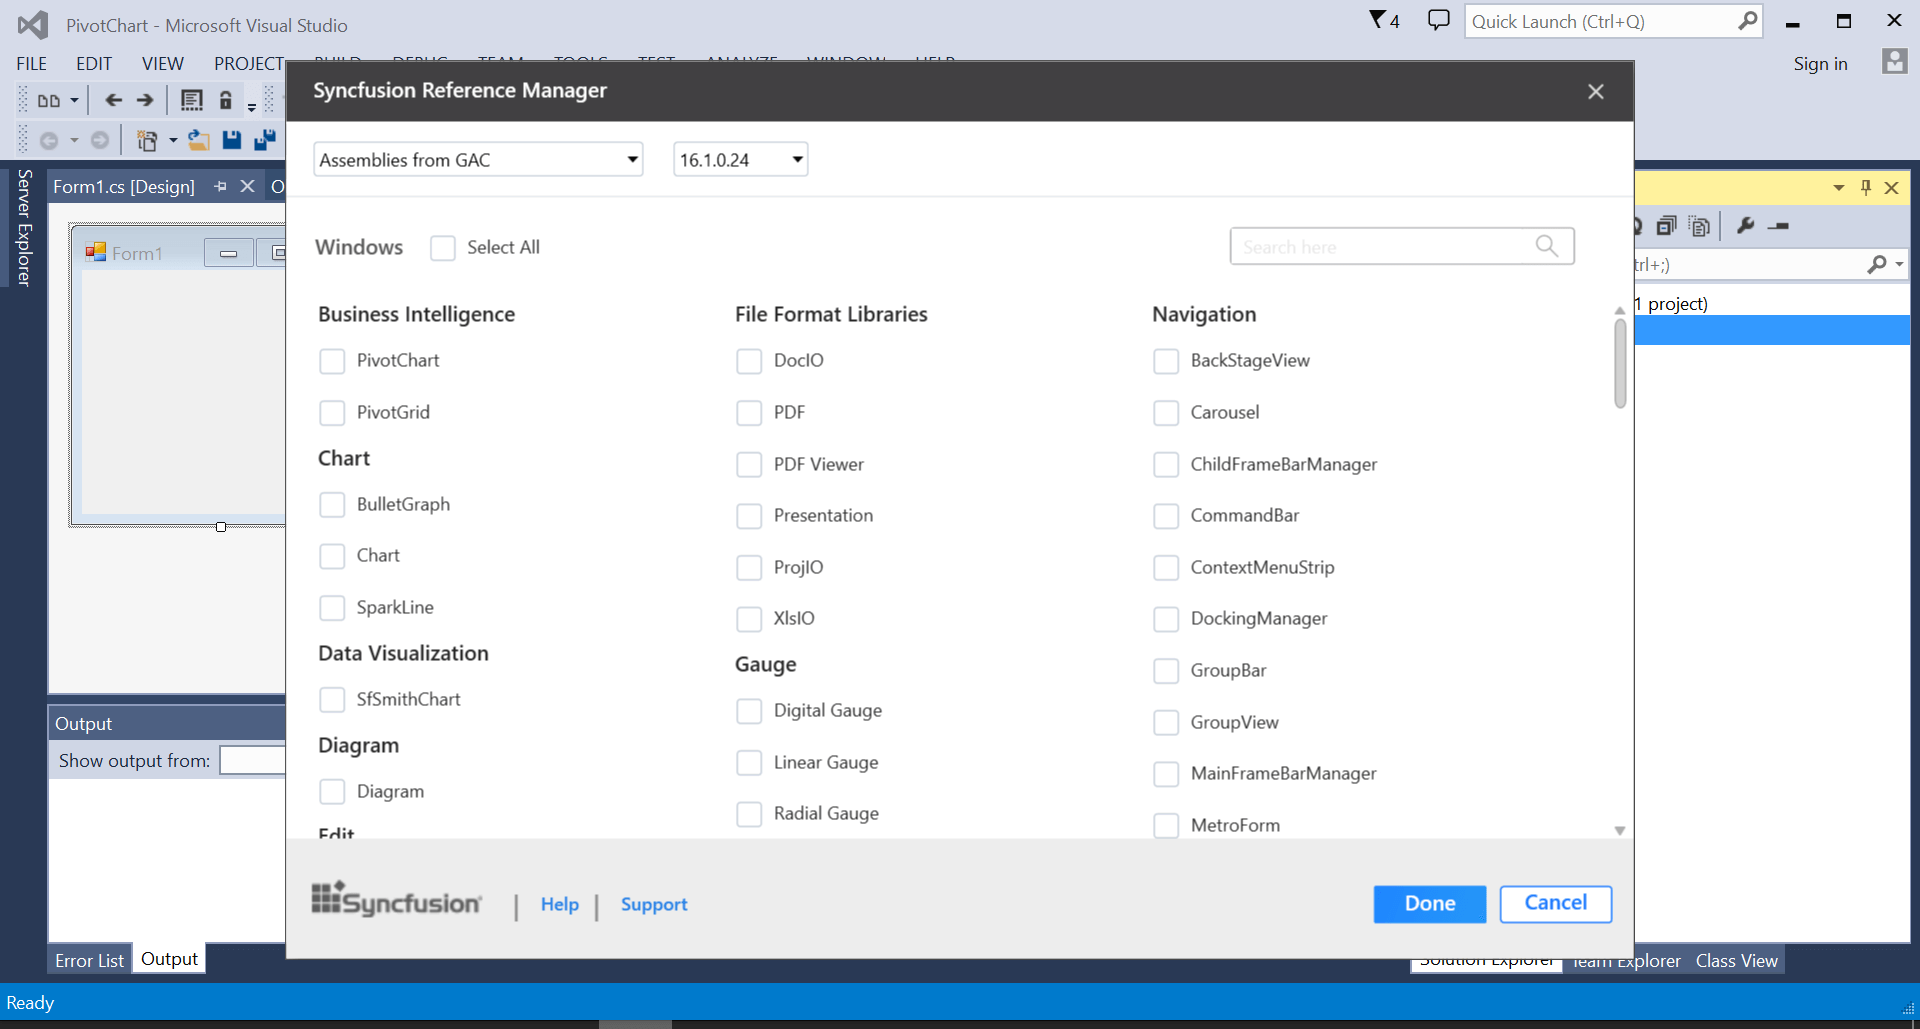
-
Select the pivot chart control by searching it through the search box. Then, click the done button to add the selected pivot chart control.
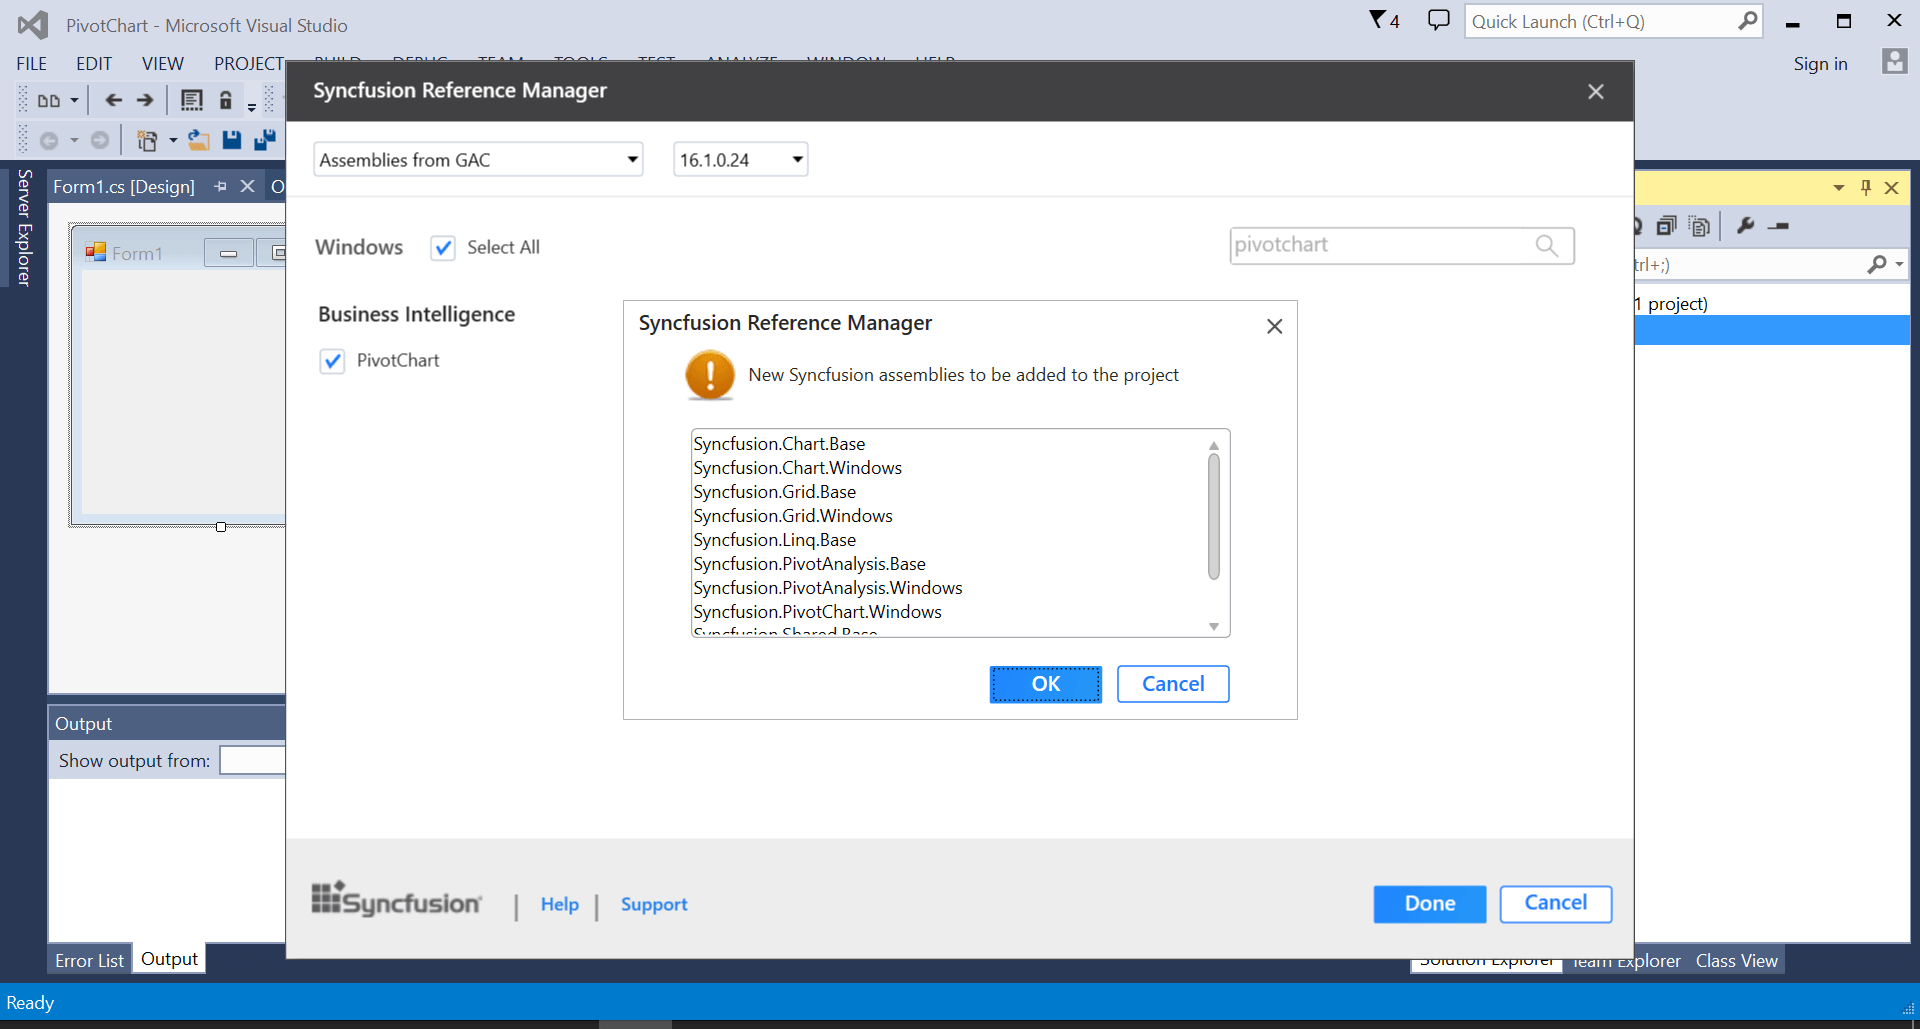
-
The required assemblies will be automatically added to the project by clicking OK.
-
Add the following code snippet in the code-behind to create a simple pivot chart control.
//Initialize a new PivotChart.
Syncfusion.Windows.Forms.PivotChart.PivotChart pivotChart1 = new Syncfusion.Windows.Forms.PivotChart.PivotChart();

//Add the PivotChart control to the parent control.
this.Controls.Add(pivotChart1);
'Initialize a new PivotChart.
Dim pivotChart1 As New Syncfusion.Windows.Forms.PivotChart.PivotChart()
'Add the PivotChart control to the parent control.
Me.Controls.Add(pivotChart1)NOTE
Syncfusion® reference manager supports for specific framework that is shipped (assemblies) in our Syncfusion Essential Studio® setup. So, if you try to add Syncfusion® assemblies in project and framework that is not supported with selected Syncfusion® version assemblies, then the dialog will be appeared by specifying that “Current build v{version} is not supported this framework v{Framework Version}”.
Binding data
This section guides you on how to bind the data source and its appropriate fields to a pivot chart control. The data source assigned to the pivot chart control should be an IEnumerable list or a DataView.
In this example, the IEnumerable list is used as the data source for the pivot chart control and the sample data source contains properties such as Product, Date, Country, State, Quantity, Amount, UnitPrice, and TotalPrice for demonstration purposes.
public class ProductSales
{
    public string Product { get; set; }
    public string Date { get; set; }
    public string Country { get; set; }
    public string State { get; set; }
    public int Quantity { get; set; }
    public double Amount { get; set; }
    public double UnitPrice { get; set; }
    public double TotalPrice { get; set; }

    public static ProductSalesCollection GetSalesData()
    {
        /// Geography
        string[] countries = new string[] { "Australia", "Germany", "Canada", "United States" };
        string[] states1 = new string[] { "New South Wales", "Queensland", };
        string[] states2 = new string[] { "Ontario", "Quebec" };
        string[] states3 = new string[] { "Bayern", "Brandenburg" };
        string[] states4 = new string[] { "New York", "Colorado", "New Mexico" };

        /// Time
        string[] dates = new string[] { "FY 2008", "FY 2009", "FY 2010", "FY 2011", "FY 20012" };

        /// Products
        string[] products = new string[] { "Bike" };
        Random r = new Random(123345);

        int numberOfRecords = 2000;
        ProductSalesCollection listOfProductSales = new ProductSalesCollection();
        for (int i = 0; i < numberOfRecords; i++)
        {
            ProductSales sales = new ProductSales();
            sales.Country = countries[r.Next(1, countries.GetLength(0))];
            sales.Quantity = r.Next(1, 12);
            /// 1 percent discount for 1 quantity
            double discount = (30000 * sales.Quantity) * (double.Parse(sales.Quantity.ToString()) / 100);
            sales.Amount = (30000 * sales.Quantity) - discount;
            sales.TotalPrice = sales.Amount * sales.Quantity;
            sales.UnitPrice = sales.Amount / sales.Quantity;
            sales.Date = dates[r.Next(r.Next(dates.GetLength(0) + 1))];
            sales.Product = products[r.Next(r.Next(products.GetLength(0) + 1))];
            switch (sales.Country)
            {
                case "Australia":
                    {
                        sales.State = states1[r.Next(states1.GetLength(0))];
                        break;
                    }
                case "Canada":
                    {
                        sales.State = states2[r.Next(states2.GetLength(0))];
                        break;
                    }
                case "Germany":
                    {
                        sales.State = states3[r.Next(states3.GetLength(0))];
                        break;
                    }
                case "United States":
                    {
                        sales.State = states4[r.Next(states4.GetLength(0))];
                        break;
                    }
            }
            listOfProductSales.Add(sales);
        }

        return listOfProductSales;
    }

    public override string ToString()
    {
        return string.Format("{0}-{1}-{2}", this.Country, this.State, this.Product);
    }

    public class ProductSalesCollection : List<ProductSales>
    {
    }
}
Public Class ProductSales
Public Property Product As String
Public Property Date As String
Public Property Country As String
Public Property State As String
Public Property Quantity As Integer
Public Property Amount As Double
Public Property UnitPrice As Double
Public Property TotalPrice As Double
Public Shared Function GetSalesData() As ProductSalesCollection
Dim countries As String() = New String() {"Australia", "Germany", "Canada", "United States"}
Dim states1 As String() = New String() {"New South Wales", "Queensland"}
Dim states2 As String() = New String() {"Ontario", "Quebec"}
Dim states3 As String() = New String() {"Bayern", "Brandenburg"}
Dim states4 As String() = New String() {"New York", "Colorado", "New Mexico"}
Dim dates As String() = New String() {"FY 2008", "FY 2009", "FY 2010", "FY 2011", "FY 20012"}
Dim products As String() = New String() {"Bike"}
Dim r As Random = New Random(123345)
Dim numberOfRecords As Integer = 2000
Dim listOfProductSales As ProductSalesCollection = New ProductSalesCollection()
For i As Integer = 0 To numberOfRecords - 1
Dim sales As ProductSales = New ProductSales()
sales.Country = countries(r.[Next](1, countries.GetLength(0)))
sales.Quantity = r.[Next](1, 12)
Dim discount As Double = (30000 * sales.Quantity) * (Double.Parse(sales.Quantity.ToString()) / 100)
sales.Amount = (30000 * sales.Quantity) - discount
sales.TotalPrice = sales.Amount * sales.Quantity
sales.UnitPrice = sales.Amount / sales.Quantity
sales.Date = dates(r.[Next](r.[Next](dates.GetLength(0) + 1)))
sales.Product = products(r.[Next](r.[Next](products.GetLength(0) + 1)))
Select Case sales.Country
Case "Australia"
sales.State = states1(r.[Next](states1.GetLength(0)))
Exit Select
Case "Canada"
sales.State = states2(r.[Next](states2.GetLength(0)))
Exit Select
Case "Germany"
sales.State = states3(r.[Next](states3.GetLength(0)))
Exit Select
Case "United States"
sales.State = states4(r.[Next](states4.GetLength(0)))
Exit Select
End Select
listOfProductSales.Add(sales)
Next
Return listOfProductSales
End Function
Public Overrides Function ToString() As String
Return String.Format("{0}-{1}-{2}", Me.Country, Me.State, Me.Product)
End Function
Public Class ProductSalesCollection
Inherits List(Of ProductSales)
End Class
End ClassNOTE
ProductSalesis a class that consists ofIListdata. For more information, refer to the Getting Started demo sample located under the following location.
<Installed Location>\Syncfusion\Essential Studio\<Installed Version>\Windows\PivotChart.Windows\Samples\Getting Started\Getting Started Demo
The pivot chart control requires the following information to populate the data from the data source.
- ItemSource: The data source for the pivot table. This object should be either an IEnumerable list or a DataTable.
- PivotAxis: Elements that should be added to the axis of the pivot chart control.
- PivotLegend: Elements that should be added to the legend of the pivot chart control.
- PivotCalculations: Calculation values that should be added as data points to the pivot chart control.
The following code snippet illustrates how to add the required information to the pivot chart control.
// Specifying the Item Source for Pivot Grid
this.pivotChart1.ItemSource = ProductSales.GetSalesData();
// Adding PivotAxis to the Control
this.pivotChart1.PivotAxis.Add(new PivotItem { FieldMappingName = "Product", TotalHeader = "Total" });
this.pivotChart1.PivotAxis.Add(new PivotItem { FieldMappingName = "Country", TotalHeader = "Total" });
this.pivotChart1.PivotAxis.Add(new PivotItem { FieldMappingName = "State", TotalHeader = "Total" });
// Adding PivotLegend to the Control
this.pivotChart1.PivotLegend.Add(new PivotItem { FieldMappingName = "Date", TotalHeader = "Total" });
// Adding PivotCalculations to the Control
this.pivotChart1.PivotCalculations.Add(new PivotComputationInfo { FieldName = "Quantity", Format = "#,##0" });
' Specifying the Item Source for Pivot Grid
Me.pivotChart1.ItemSource = ProductSales.GetSalesData()
' Adding PivotAxis to the Control
Me.pivotChart1.PivotAxis.Add(New PivotItem With {.FieldMappingName = "Product", .TotalHeader = "Total"})
Me.pivotChart1.PivotAxis.Add(New PivotItem With {.FieldMappingName = "Country", .TotalHeader = "Total"})
Me.pivotChart1.PivotAxis.Add(New PivotItem With {.FieldMappingName = "State", .TotalHeader = "Total"})
' Adding PivotLegend to the Control
Me.pivotChart1.PivotLegend.Add(New PivotItem With {.FieldMappingName = "Date", .TotalHeader = "Total"})
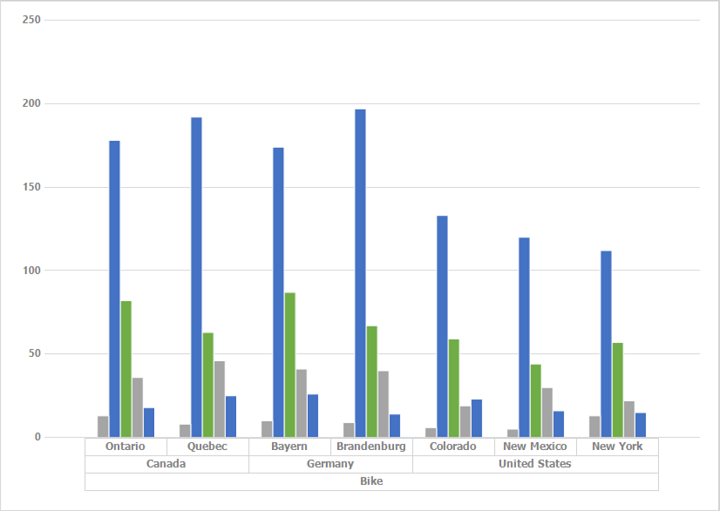
' Adding Pivot Calculations to the Control
Me.pivotChart1.PivotCalculations.Add(New PivotComputationInfo With {.FieldName = "Quantity", .Format = "#,##0"})Finally, run the application to obtain the following output.
Real time updates
PivotChartUpdatingManager provides support for updating the series values automatically whenever the data gets changed in its underlying collection. This support can be enabled by setting the EnableUpdating property to true.
//Updates the PivotChart series values whenever the data gets changed in the underlying data source.
this.pivotChart1.EnableUpdating = true;
'Updates the PivotChart series values whenever the data gets changed in the underlying data source.
Me.pivotChart1.EnableUpdating = TrueNOTE
The default value of the
EnableUpdatingproperty is false.
Begin update and end update
When you make more changes in the underlying data source, the pivot chart will be updated for every change and the performance will be degraded. So, to do more changes or more operations, do them between the BeginUpdate and EndUpdate methods of the pivot chart. The BeginUpdate method will temporarily freeze the painting or refreshing of the control until the EndUpdate method is called. After all the changes have been made, invoke the EndUpdate method to resume painting of the control.
//Suspends the painting until EndUpdate method is invoked
this.pivotChart1.BeginUpdate();

//do your bulk changes here

//Resumes the painting which is suspended
this.pivotChart1.EndUpdate();
'Suspends the painting
Me.pivotChart1.BeginUpdate()
'do your bulk changes here
'Resumes the painting which is suspended
Me.pivotChart1.EndUpdate()You can find the complete getting started sample from this link.