Axes in UWP Smith Chart (SfSmithChart)
15 Jul 202615 minutes to read
Typically, the SmithChart has been used with two axes that are used to measure and categorize the data.
- Horizontal Axis (Resistance)
- Radial Axis (Reactance)
Horizontal axis
Horizontal axis scale is used to measure normalized resistance value.
The following topics explain in detail about the axis and its parts.
MajorGridlines
By default, major gridlines are automatically added to the Axis. SfSmithChart supports the customization of major gridlines. The visibility of the major gridlines can be controlled by using the ShowMajorGridlines property.
<syncfusion:SfSmithChart>
     <syncfusion:SfSmithChart.HorizontalAxis>
         <syncfusion:HorizontalAxis ShowMajorGridlines="False">
         </syncfusion:HorizontalAxis>
     </syncfusion:SfSmithChart.HorizontalAxis>
 </syncfusion:SfSmithChart>
//Customizing horizontal(Resistance) axis to the chart
chart.HorizontalAxis = new HorizontalAxis();
chart.HorizontalAxis.ShowMajorGridlines = false;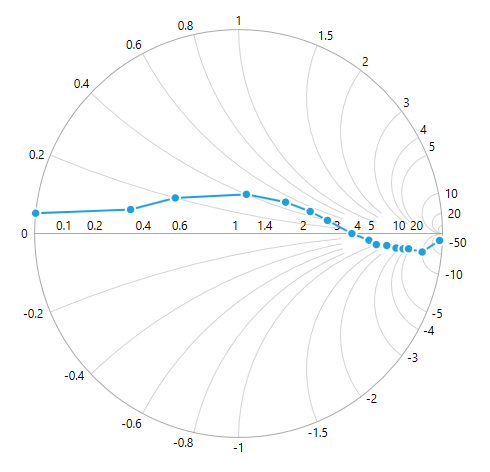
MajorGridlineStyle
SfSmithChart provides support to customize the style of the major gridlines by defining the MajorGridlineStyle property as shown in the below code snippet.
<syncfusion:SfSmithChart x:Name="SmithChart">
    <syncfusion:SfSmithChart.Resources>
        <Style TargetType="Path" x:Key="lineStyle">
            <Setter Property="Stroke" Value="BurlyWood"></Setter>
            <Setter Property="StrokeDashArray" Value="5,3"></Setter>
        </Style>
    </syncfusion:SfSmithChart.Resources>
        <syncfusion:SfSmithChart.HorizontalAxis>
        <syncfusion:HorizontalAxis MajorGridlineStyle="{StaticResource lineStyle}">
        </syncfusion:HorizontalAxis>
   </syncfusion:SfSmithChart.HorizontalAxis>
</syncfusion:SfSmithChart>chart.HorizontalAxis.MajorGridlineStyle = this.Grid1.Resources["lineStyle"] as Style;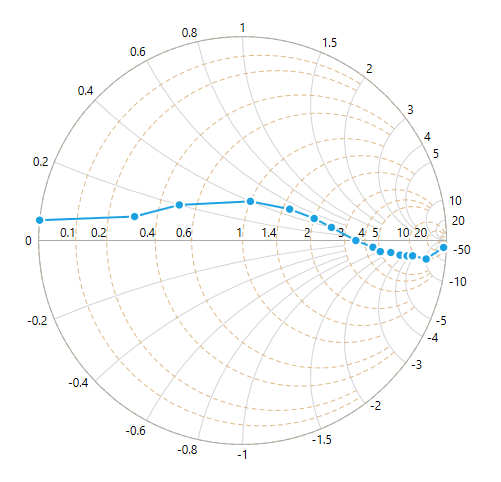
MinorGridlines
By default, minor gridlines are not added to the Axis. The visibility of the minor gridlines can be controlled by using the ShowMinorGridlines property.
<syncfusion:SfSmithChart>
     <syncfusion:SfSmithChart.HorizontalAxis>
         <syncfusion:HorizontalAxis ShowMinorGridlines="True">
         </syncfusion:HorizontalAxis>
     </syncfusion:SfSmithChart.HorizontalAxis>
</syncfusion:SfSmithChart>
//Customizing horizontal(Resistance) axis to the chart
chart.HorizontalAxis = new HorizontalAxis();
chart.HorizontalAxis.ShowMinorGridlines = true;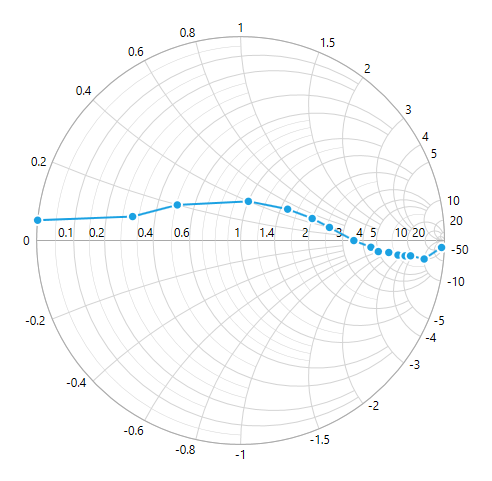
MinorGridlinesCount
Minor gridlines can be added by defining the MinorGridlinesCount property. By default, this value is eight. It means, every 100 pixels it renders a maximum of eight minor gridlines.
<syncfusion:SfSmithChart>
     <syncfusion:SfSmithChart.HorizontalAxis>
         <syncfusion:HorizontalAxis ShowMinorGridlines="True" MinorGridlinesCount="12">
         </syncfusion:HorizontalAxis>
     </syncfusion:SfSmithChart.HorizontalAxis>
 </syncfusion:SfSmithChart>
//Customizing horizontal(Resistance) axis to the chart
chart.HorizontalAxis = new HorizontalAxis();
chart.HorizontalAxis.ShowMinorGridlines = true;
chart.HorizontalAxis.MinorGridlinesCount = 12;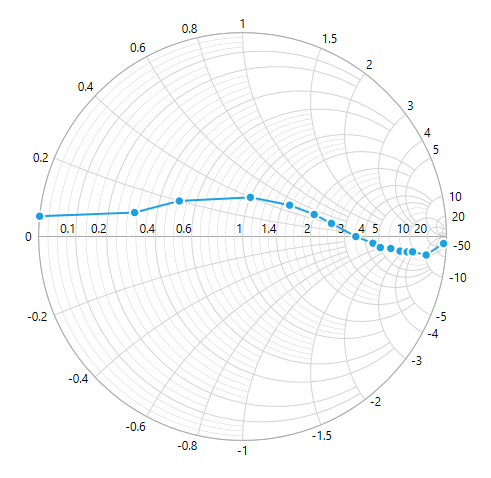
MinorGridlineStyle
SfSmithChart provides support to customize the style of the minor gridlines by defining the MinorGridlineStyle property as shown in the below code snippet.
<syncfusion:SfSmithChart x:Name="SmithChart">
    <syncfusion:SfSmithChart.Resources>
        <Style TargetType="Path" x:Key="lineStyle">
            <Setter Property="Stroke" Value="BurlyWood"></Setter>
            <Setter Property="StrokeThickness" Value="0.45"></Setter>
            <Setter Property="StrokeDashArray" Value="7,3"></Setter>
        </Style>
    </syncfusion:SfSmithChart.Resources>
        <syncfusion:SfSmithChart.HorizontalAxis>
        <syncfusion:HorizontalAxis ShowMinorGridlines="True" MinorGridlinesCount="12" MinorGridlineStyle="{StaticResource lineStyle}">
        </syncfusion:HorizontalAxis>
   </syncfusion:SfSmithChart.HorizontalAxis>
</syncfusion:SfSmithChart>chart.HorizontalAxis.MinorGridlineStyle = this.Grid1.Resources["lineStyle"] as Style;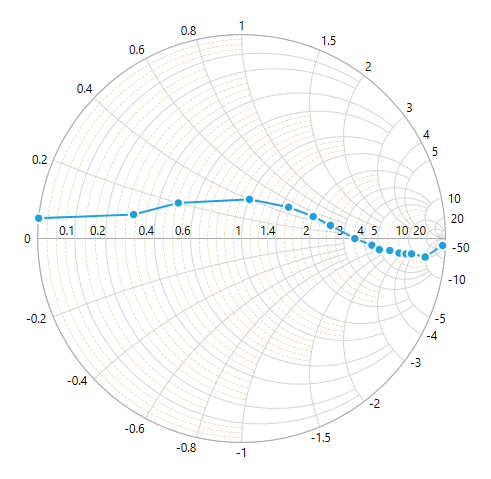
AxisLine
SfSmithChart provides support to customize the style of the axis line by defining the AxisLineStyle property and change the visibility by using ShowAxisLine property as shown in the below code snippet.
<syncfusion:SfSmithChart x:Name="SmithChart">
    <syncfusion:SfSmithChart.Resources>
        <Style TargetType="Path" x:Key="lineStyle">
                    <Setter Property="Stroke" Value="Black"></Setter>
                    <Setter Property="StrokeThickness" Value="1"></Setter>
                    <Setter Property="StrokeDashArray" Value="7,3"></Setter>
                </Style>
    </syncfusion:SfSmithChart.Resources>
        <syncfusion:SfSmithChart.HorizontalAxis>
        <syncfusion:HorizontalAxis ShowAxisLine="True" AxisLineStyle="{StaticResource lineStyle}">
        </syncfusion:HorizontalAxis>
   </syncfusion:SfSmithChart.HorizontalAxis>
</syncfusion:SfSmithChart>chart.HorizontalAxis.AxisLineStyle = this.Grid1.Resources["lineStyle"] as Style;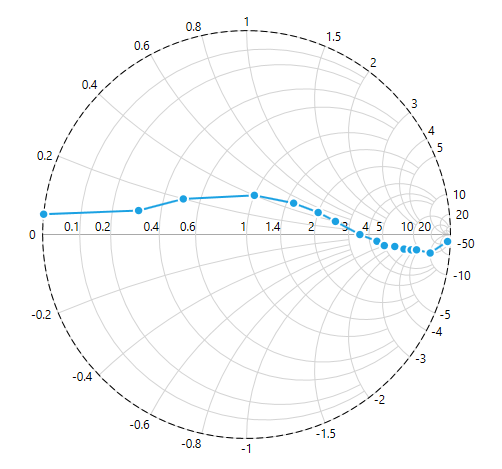
LabelPlacement
The LabelPlacement property is used to position the axis label either inside or outside of the chart plotting area. By default, LabelPlacement is Outside.
<syncfusion:SfSmithChart x:Name="SmithChart">
        <syncfusion:SfSmithChart.HorizontalAxis>
        <syncfusion:HorizontalAxis LabelPlacement="Inside">
        </syncfusion:HorizontalAxis>
   </syncfusion:SfSmithChart.HorizontalAxis>
</syncfusion:SfSmithChart>
//Positioning the horizontal axis labels to bottom of AxisLine
chart.HorizontalAxis.LabelPlacement = LabelPlacement.Inside;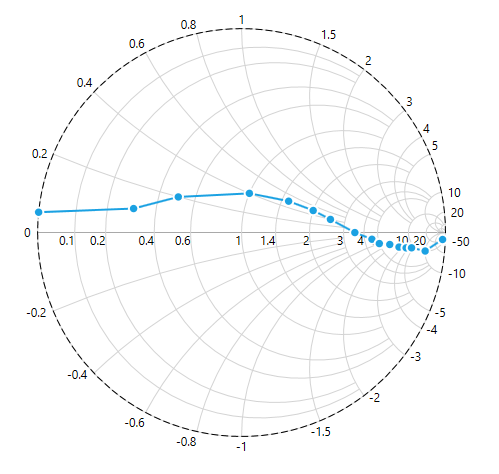
LabelIntersectAction
When the axis labels overlap with each other based on the chart dimensions and label size, use the LabelIntersectAction property of the axis to avoid overlapping. The default value of the LabelIntersectAction is Hide.
<syncfusion:SfSmithChart x:Name="SmithChart">
        <syncfusion:SfSmithChart.HorizontalAxis>
        <syncfusion:HorizontalAxis LabelIntersectAction="None">
        </syncfusion:HorizontalAxis>
   </syncfusion:SfSmithChart.HorizontalAxis>
</syncfusion:SfSmithChart>
//Set axis label intersect action
chart.HorizontalAxis.LabelIntersectAction = LabelIntersectActions.None;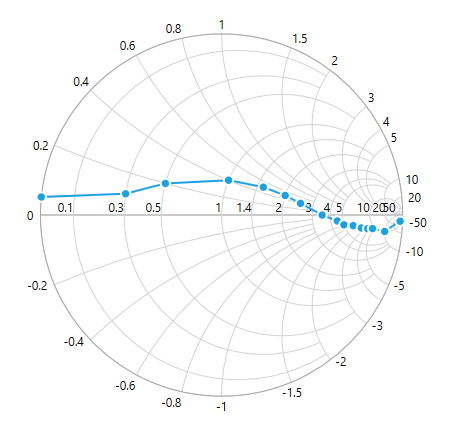
Radial axis
Radial axis scale is used to measure the normalized reactance values.
MajorGridlines
By default, major gridlines are automatically added to the Axis. SfSmithChart supports customization of major gridline. The visibility of the major gridlines can be controlled by using the ShowMajorGridlines property.
<syncfusion:SfSmithChart>
     <syncfusion:SfSmithChart.RadialAxis>
         <syncfusion:RadialAxis ShowMajorGridlines="False">
         </syncfusion:RadialAxis >
     </syncfusion:SfSmithChart.RadialAxis >
 </syncfusion:SfSmithChart>
//Customizing radial(Reactance) axis to the chart
chart.RadialAxis = new RadialAxis();
chart.RadialAxis.ShowMajorGridlines = false;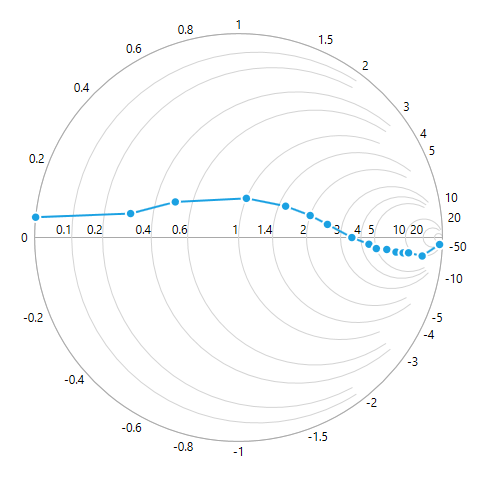
MajorGridlineStyle
SfSmithChart provides support to customize the style of the major gridlines by defining the MajorGridlineStyle property as shown in the below code snippet.
<syncfusion:SfSmithChart x:Name="SmithChart">
    <syncfusion:SfSmithChart.Resources>
        <Style TargetType="Path" x:Key="lineStyle">
            <Setter Property="Stroke" Value="BurlyWood"></Setter>
            <Setter Property="StrokeDashArray" Value="5,3"></Setter>
        </Style>
    </syncfusion:SfSmithChart.Resources>
        <syncfusion:SfSmithChart.RadialAxis>
        <syncfusion:RadialAxis MajorGridlineStyle="{StaticResource lineStyle}">
        </syncfusion:RadialAxis >
   </syncfusion:SfSmithChart.RadialAxis>
</syncfusion:SfSmithChart>chart.RadialAxis.MajorGridlineStyle = this.Grid1.Resources["lineStyle"] as Style;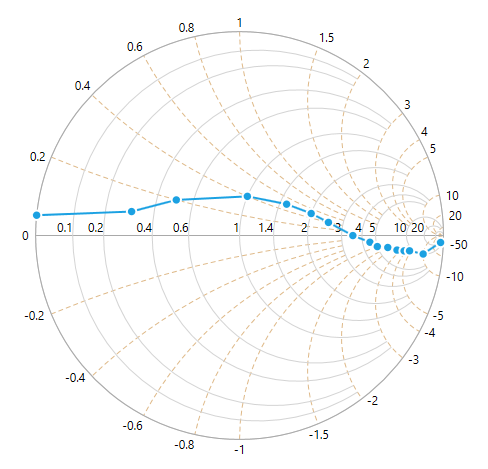
MinorGridlines
By default, minor gridlines are not added to the Axis. The visibility of the minor gridlines can be controlled by using the ShowMinorGridlines property.
<syncfusion:SfSmithChart>
     <syncfusion:SfSmithChart.RadialAxis>
         <syncfusion:RadialAxis ShowMinorGridlines="True">
         </syncfusion:RadialAxis>
     </syncfusion:SfSmithChart.RadialAxis>
 </syncfusion:SfSmithChart>
//Customizing radial(Reactance) axis to the chart
chart.RadialAxis = new RadialAxis();
chart.RadialAxis.ShowMinorGridlines = true;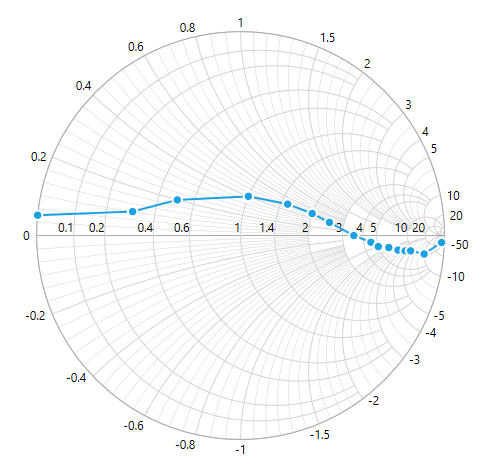
MinorGridlinesCount
Minor gridlines can be added by defining the MinorGridlinesCount property. By default, this value is eight. It means, every 100 pixels it renders a maximum of eight minor gridlines.
<syncfusion:SfSmithChart>
     <syncfusion:SfSmithChart.RadialAxis>
         <syncfusion:RadialAxis ShowMinorGridlines="True" MinorGridlinesCount="12">
         </syncfusion:RadialAxis>
     </syncfusion:SfSmithChart.RadialAxis>
 </syncfusion:SfSmithChart>
//Customizing radial(Reactance) axis to the chart
chart.RadialAxis = new RadialAxis();
chart.RadialAxis.ShowMinorGridlines = true;
chart.RadialAxis.MinorGridlinesCount = 12;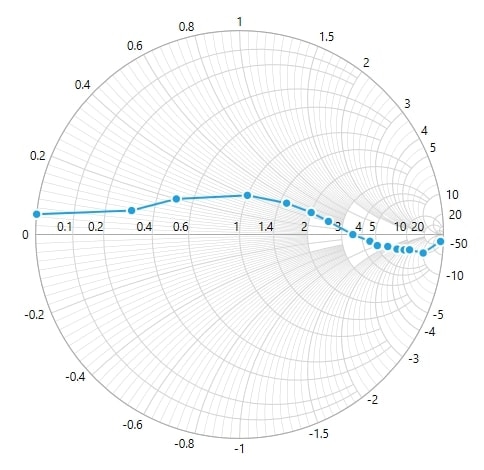
MinorGridlineStyle
SfSmithChart provides support to customize the style of the minor gridlines by defining the vMinorGridlineStyle property as shown in the below code snippet.
<syncfusion:SfSmithChart x:Name="SmithChart">
    <syncfusion:SfSmithChart.Resources>
        <Style TargetType="Path" x:Key="lineStyle">
            <Setter Property="Stroke" Value="BurlyWood"></Setter>
            <Setter Property="StrokeThickness" Value="0.45"></Setter>
            <Setter Property="StrokeDashArray" Value="7,3"></Setter>
        </Style>
    </syncfusion:SfSmithChart.Resources>
        <syncfusion:SfSmithChart.RadialAxis>
        <syncfusion:RadialAxis ShowMinorGridlines="True" MinorGridlinesCount="12" MinorGridlineStyle="{StaticResource lineStyle}">
        </syncfusion:RadialAxis>
   </syncfusion:SfSmithChart.RadialAxis>
</syncfusion:SfSmithChart>chart.RadialAxis.MinorGridlineStyle = this.Grid1.Resources["lineStyle"] as Style;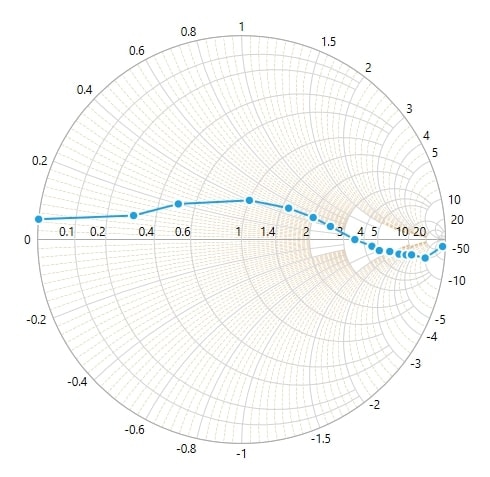
AxisLine
SfSmithChart provides support to customize the style of the axis line by defining the AxisLineStyle property and change the visibility by using ShowAxisLine property as shown in the below code snippet.
<syncfusion:SfSmithChart x:Name="SmithChart">
    <syncfusion:SfSmithChart.Resources>
        <Style TargetType="Path" x:Key="lineStyle">
                    <Setter Property="Stroke" Value="Black"></Setter>
                    <Setter Property="StrokeThickness" Value="1"></Setter>
                    <Setter Property="StrokeDashArray" Value="7,3"></Setter>
                </Style>
    </syncfusion:SfSmithChart.Resources>
        <syncfusion:SfSmithChart.RadialAxis>
        <syncfusion:RadialAxis ShowAxisLine="True" AxisLineStyle="{StaticResource lineStyle}">
        </syncfusion:RadialAxis>
   </syncfusion:SfSmithChart.RadialAxis>
</syncfusion:SfSmithChart>chart.RadialAxis.AxisLineStyle = this.Grid1.Resources["lineStyle"] as Style;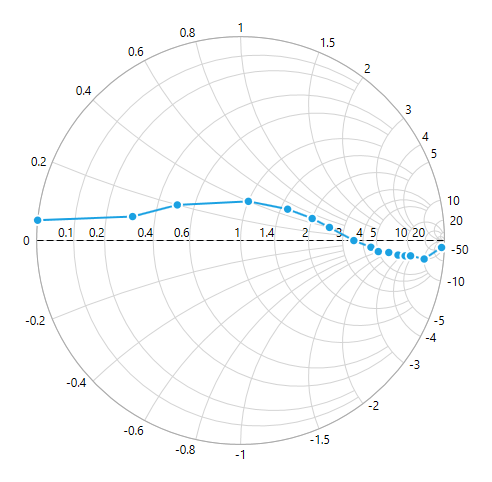
LabelPlacement
The LabelPlacement property is used to position the axis label either inside or outside of the chart plotting area. By default, LabelPlacement is Outside.
<syncfusion:SfSmithChart x:Name="SmithChart">
        <syncfusion:SfSmithChart.RadialAxis>
        <syncfusion:RadialAxis LabelPlacement="Inside">
        </syncfusion:RadialAxis>
   </syncfusion:SfSmithChart.RadialAxis>
</syncfusion:SfSmithChart>
//Positioning the radial axis labels to inside of Circle
chart.RadialAxis.LabelPlacement = LabelPlacement.Inside;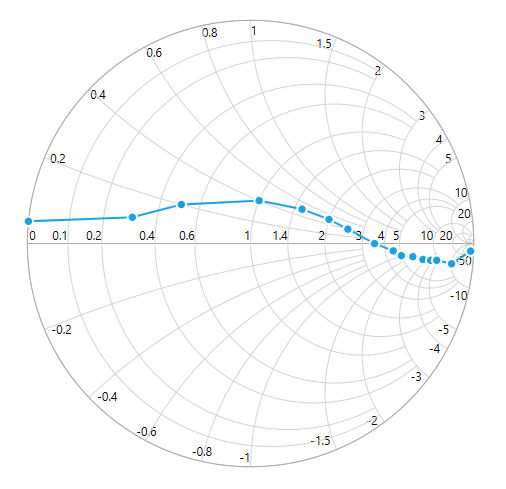
LabelIntersectAction
When the axis labels overlap with each other based on the chart dimensions and label size, use the LabelIntersectAction property of the axis to avoid overlapping. The default value of the LabelIntersectAction is Hide.
<syncfusion:SfSmithChart x:Name="SmithChart">
        <syncfusion:SfSmithChart.RadialAxis>
        <syncfusion:RadialAxis LabelIntersectAction="None">
        </syncfusion:RadialAxis>
   </syncfusion:SfSmithChart.RadialAxis>
</syncfusion:SfSmithChart>
//Set axis label intersect action
chart.RadialAxis.LabelIntersectAction = LabelIntersectActions.None;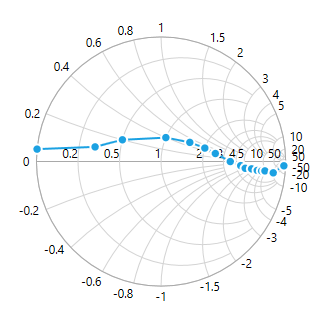
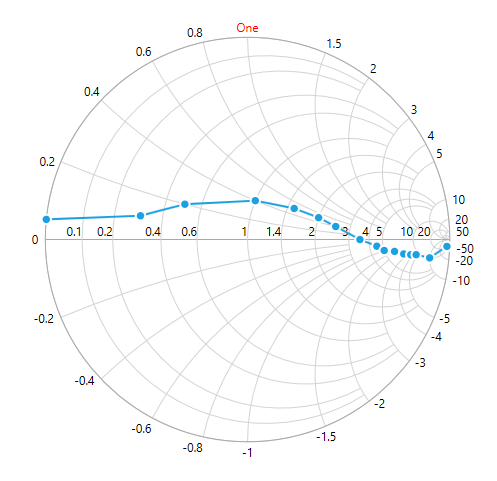
Events
-
LabelCreated– Occurs when the label is created. - C#
//Axis label created event hooked for RadialAxis
chart.RadialAxis.LabelCreated += RadialAxis_LabelCreated;

  //Event called for every label created in the axis.
  void RadialAxis_LabelCreated(object sender, EventArgs e)
  {
      var axisLabel = e as ChartAxisLabelEventArgs;

      //Customizing the specific label text and color
      if (axisLabel.Label.Text == "1")
      {
          axisLabel.Label.Text = "One";
          axisLabel.Label.Foreground = new SolidColorBrush(Colors.Red);
      }
  }