Quantitative Scale in UWP Bullet Graph (SfBulletGraph)
15 Jul 20261 minute to read
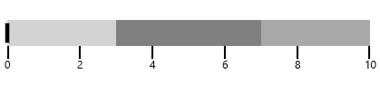
Quantitative scale contains two major components such as ticks and labels, which give the look of a bar graph. It defines the frequency of labels and tick marks with overall Minimum and Maximum values for the declared Interval. The length of the quantitative scale can be customized by using the QuantitativeScaleLength property.
<syncfusion:SfBulletGraph QuantitativeScaleLength="300" Minimum="0" Maximum="10" Interval="2" />SfBulletGraph bullet = new SfBulletGraph();
bullet.QuantitativeScaleLength = 300;
bullet.Minimum = 0;
bullet.Maximum = 10;
bullet.Interval = 2;
this.Grid.Children.Add(bullet);