Getting Started with UWP Bullet Graph (SfBulletGraph)
24 May 20219 minutes to read
This section explains you the steps required to configure the SfBulletGraph and also explains the steps to add basic elements of SfBulletGraph through various API’s available within it.
Configuring SfBulletGraph
SfBulletGraph is available in the following assembly and namespace:
Assembly: Syncfusion.SfBulletGraph.UWP
Namespace: Syncfusion.UI.Xaml.BulletGraph
<syncfusion:SfBulletGraph/>SfBulletGraph bullet = new SfBulletGraph();
this.Grid.Children.Add(bullet);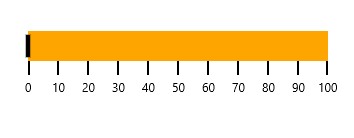
As you can see now in the above image, the SfBulletGraph displays its default elements. To customize its element, you have to add respective elements to SfBulletGraph, following section contains the steps to add the basic elements to SfBulletGraph.
Adding Caption
You can assign a caption to SfBulletGraph by making use of “Caption” property and also you can position it either near or far using “CaptionPosition” property.
<syncfusion:SfBulletGraph CaptionPosition="Far" Caption="Revenue YTD"
    </syncfusion:SfBulletGraph>
SfBulletGraph bullet = new SfBulletGraph();
bullet.Caption = Revenue YTD;
bullet.CaptionPosition = BulletGraphCaptionPosition.Far;
this.Grid.Children.Add(bullet);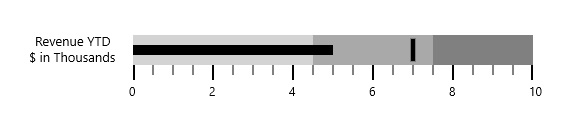
Configuring Ticks and Labels
You can configure Ticks and Labels of Quantitative Scale by making use of following API’s available in SfBulletGraph.
They are:
- Minimum
- Maximum
- Interval
- MinorTicksPerInterval
- MajorTickSize
- MinorTickSize
- MajorTickStroke
- LabelStroke
- MinorTickStroke
<syncfusion:SfBulletGraph Minimum="0" Maximum="10" Interval="2"
                                  QualitativeRangesSize="30"
                                  QuantitativeScaleLength="300"
                                  MinorTicksPerInterval="3"
                                  MajorTickSize="15" MinorTickSize="10"
                                  MajorTickStroke="Red" LabelStroke="Black" MinorTickStroke="Green">
        </syncfusion:SfBulletGraph>
SfBulletGraph bullet = new SfBulletGraph();
bullet.FlowDirection = BulletGraphFlowDirection.Forward;
bullet.Orientation = Orientation.Horizontal;
bullet.QualitativeRangesSize = 30;
bullet.QuantitativeScaleLength = 300;
bullet.Minimum = 0;
bullet.Maximum = 10;
bullet.Interval = 2;
bullet.MinorTicksPerInterval = 3;
bullet.MajorTickSize = 15;
bullet.MinorTickSize = 10;
bullet.MajorTickStroke = new SolidColorBrush(Colors.Red);
bullet.LabelStroke = new SolidColorBrush(Colors.Black);
bullet.MinorTickStroke = new SolidColorBrush(Colors.Green);
this.Grid.Children.Add(bullet);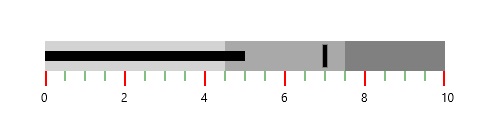
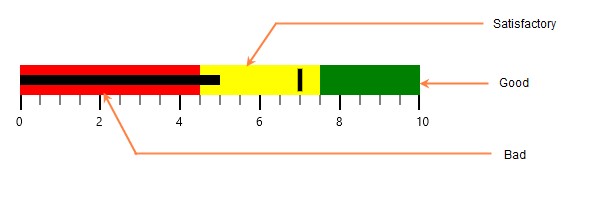
Adding Ranges
You can add ranges to SfBulletGraph by creating ranges collection using QualitativeRanges.
<syncfusion:SfBulletGraph Orientation="Horizontal" Minimum="0" Maximum="10" Interval="2"  FlowDirection="Forward"
                                  QualitativeRangesSize="30"
                                  QuantitativeScaleLength="300">
            <syncfusion:SfBulletGraph.QualitativeRanges>
                <syncfusion:QualitativeRange RangeEnd="4.5"
                                             RangeStroke="Red"
                                             RangeOpacity="1">
                </syncfusion:QualitativeRange>
                <syncfusion:QualitativeRange RangeEnd="7.5"
                                             RangeStroke="Yellow"
                                             RangeOpacity="1">
                </syncfusion:QualitativeRange>
                <syncfusion:QualitativeRange RangeEnd="10"
                                             RangeStroke="Green"
                                             RangeOpacity="1">
                </syncfusion:QualitativeRange>
            </syncfusion:SfBulletGraph.QualitativeRanges>
        </syncfusion:SfBulletGraph>
SfBulletGraph bullet = new SfBulletGraph();
bullet.QualitativeRangesSize = 30;
bullet.QuantitativeScaleLength = 300;
bullet.FlowDirection = BulletGraphFlowDirection.Forward;
bullet.Orientation = Orientation.Horizontal;
bullet.Minimum = 0;
bullet.Maximum = 10;
bullet.Interval = 2;
bullet.QualitativeRanges.Add(new QualitativeRange()
{
RangeEnd = 4.5,
RangeOpacity = 1,
RangeStroke = new SolidColorBrush(Colors.Red)
});
bullet.QualitativeRanges.Add(new QualitativeRange()
{
RangeEnd = 7.5,
RangeOpacity = 1,
RangeStroke = new SolidColorBrush(Colors.Yellow)
});
bullet.QualitativeRanges.Add(new QualitativeRange()
{
RangeEnd = 10,
RangeOpacity = 1,
RangeStroke = new SolidColorBrush(Colors.Green)
});
this.Grid.Children.Add(bullet);SfBulletGraph ranges are displayed as follows.