How can I help you?
TreeMap Elements
TreeMap contains various elements such as,
LegendHeadersLabels
Legend
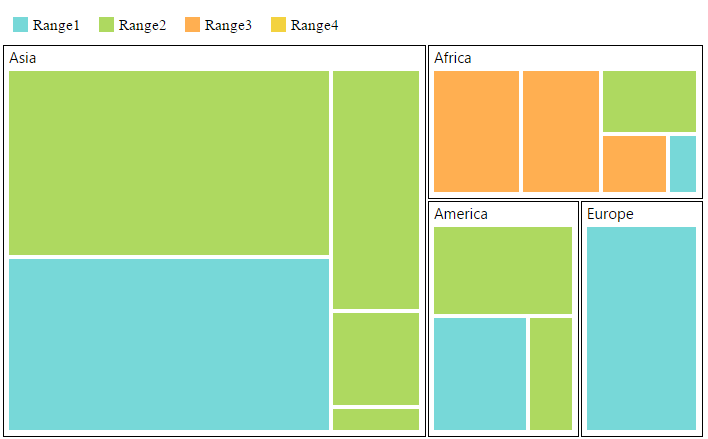
You can set the color value of leaf nodes using treeMapLegend. This legend is appropriate only for the TreeMap whose leaf nodes are colored using rangeColorMapping.
You can set showLegend property value to “true” to enable or disable legend visibility.
TreeMap Legend
You can customize the treemap legend using following properties
-
For customizing the alignment of legend, you can use
alignmentproperty. -
You can set the legend column count using
column countproperty. -
To set the dock position of the legend text, you can use
dockPosition -
You can specify the size of the legend by setting
heightandwidthof thetreeMapLegend. -
You can decide the size of the legend icons by setting
iconWidthandiconHeightproperties of thetreeMapLegendproperty avail in TreeMap. -
You can customize the left and right label text for the legend using
leftLabelandrightLabelproperties. -
To set the legend mode as default or interactive, you can use
modeproperty. -
Using the property
template, you can specify template for legend settings. -
To set the legend title, you can use the
titleproperty of thelegendSettings.
Label for Legend
You can customize the labels of the legend item using legendLabel property of rangeColorMapping.
/// <reference path="../tsfiles/jquery.d.ts"></reference>
/// <reference path="../tsfiles/ej.web.all.d.ts"></reference>

module treeMapcomponent {

       $(function () {

           var treeMapSample = new ej.datavisualization.TreeMap($("#treeMap"), {
                dataSource: population_data,
                colorValuePath: "Growth",
                showLegend: true,
                itemsLayoutMode:"Squarified",
                weightValuePath: "Population",
                rangeColorMapping: [
                { color: "#77D8D8", from: "0", to: "1" ,legendLabel:"Range1"},
                { color: "#AED960", from: "0", to: "2",legendLabel:"Range2" },
                { color: "#FFAF51", from: "0", to: "3", legendLabel: "Range3" },
                { color: "#F3D240", from: "0", to: "4", legendLabel: "Range4" }
                ],
                levels: [
                  { groupPath: "Continent", groupGap: 5 }
                ],
                legendSettings:{
					height:40,
					width:700
				}
            });
        });

}
Try it: Legend Label
Interactive Legend
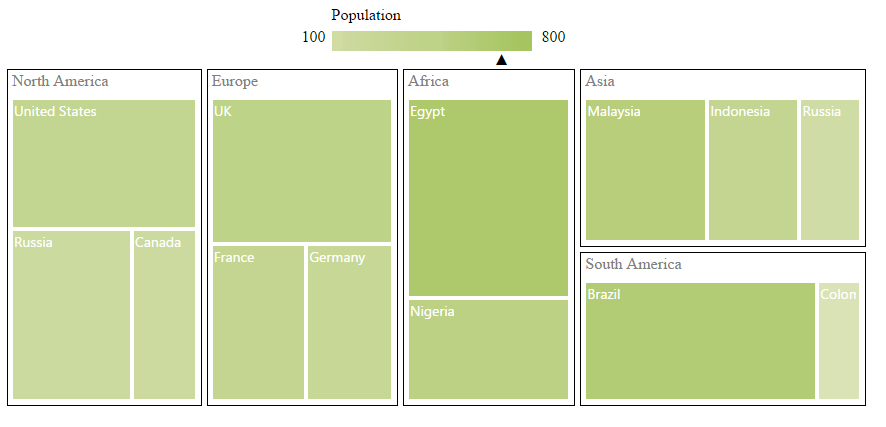
The legends can be made interactive with an arrow mark indicating the exact range color in the legend when the mouse hovers over the corresponding treemap items. You can enable this option by setting mode property in legend settings value as “interactive” and default value of mode property is “default” to enable the normal legend.
Title for Interactive Legend
You can provide the title for interactive legend by using title property in legend settings.
Label for Interactive Legend
You can provide the left and right labels to interactive legend by using leftLabel and rightLabel properties in legend settings.
$(function () {
        var treeMapSample = new ej.datavisualization.TreeMap($("#treeMap"), {
                // ...
                showLegend: true,
                legendSettings: {
                    height: 15,
                    width: 150,
                    mode: "interactive",
                    title: "Population",
                    leftLabel: "0.5M",
                    rightLabel: "40M",
                    dockPosition: "top"
                },
                // ...
        });
    });
Try it: Interactive_Legend
Header
You can set headers for each level by setting the showHeader property of the each TreeMap levels. The headerHeight property helps to set the height of the header and Group path value determines the header value. You can customize the default header appearance by setting the header template of the TreeMap levels.
<div  id="treeMap" style="width: 950px; height: 500px; "></div>

    <script type="text/javascript">
        $(function () {
           var treeMapSample = new ej.datavisualization.TreeMap($("#treeMap"), {
                // ...
                levels: [
                    {groupPath: "Continent", groupGap: 2, headerHeight: 25,  headerTemplate: 'Template' }
                ],
                // ...
            });
        });
    </script>

    <script  id="Template" type="application/jsrender">
        <div style="background-color: white; margin:5px">
            <label style="color:black;font-size:large;" ></label><br />
        </div>
    </script>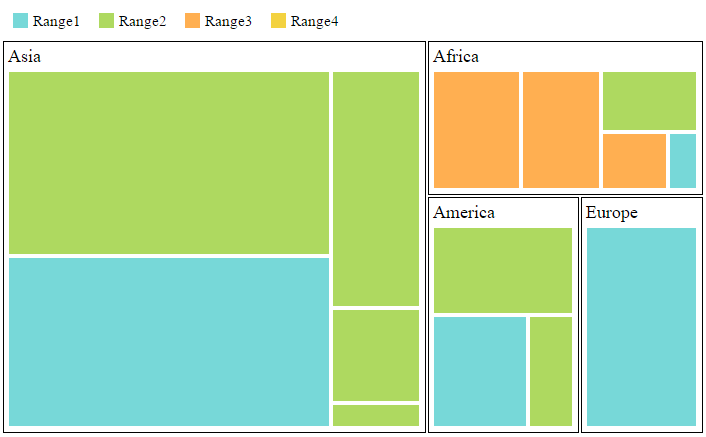
Try it: Treemap Header
Customizing the header
The text in the header can be customized by triggering the event headerTemplateRendering of the TreeMap. This event is triggered before rendering the header template.
<div  id="treeMap" style="width: 950px; height: 500px; "></div>

    <script type="text/javascript">
        $(function () {
           var treeMapSample = new ej.datavisualization.TreeMap($("#treeMap"), {
                // ...
                levels: [
                    {groupPath: "Continent", headerHeight: 25,  headerTemplate: 'Template' }
                ],
                headerTemplateRendering:'loadTemplate',
                // ...
            });
        });
    </script>

    <script  id="Template" type="application/jsrender">
        <div style="background-color: white; margin:5px">
            <label style="color:black;font-size:large;" ></label><br />
        </div>
    </script>

    <script>
    function loadTemplate(sender) {
        //...
    }
    </script>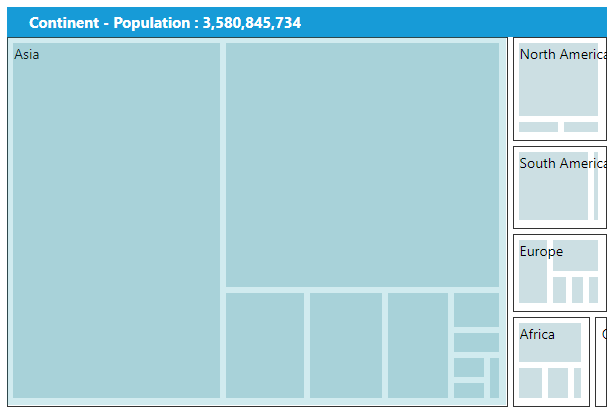
Label
You can also set labels for the leaf nodes by setting the showLabels property as true. Group path value is displayed as a label for leaf nodes. You can customize the default label appearance by setting the labelTemplate of the TreeMap levels.
<div  id="treeMap" style="width: 1100px; height: 550px; "></div>

    <script type="text/javascript">
        $(function () {
           var treeMapSample = new ej.datavisualization.TreeMap($("#treeMap"), {
                // ...
                levels: [
                  {groupPath: "Continent", showLabels: true, groupGap: 2, headerHeight: 20,  headerTemplate: 'Template', labelPosition:"topLeft", }
                ],
                leafItemSettings: { labelPath: "Region", showLabels: true},
                legendSettings:{
				    height:40,
					width:700
			    }
            });
        });
    </script>

    <script  id="Template" type="application/jsrender">
        <div style="background-color: white; margin:5px">
            <label style="color:black;font-size:medium;" ></label><br />
        </div>
    </script>
Try it: Treemap Label
Customizing the Overflow labels
You can handle the label overflow, by specifying any one of the following values to the property textOverflowas
None - It displays the default label text.
Hide - You can hide the label, when it exceeds the header width.
Wrap - You can wrap the label text by letter.
WrapByWord - You can wrap the label text by word.
<div  id="treeMap" style="width: 1100px; height: 550px; "></div>

    <script type="text/javascript">
        $(function () {
           var treeMapSample = new ej.datavisualization.TreeMap($("#treeMap"), {
                // ...
                levels: [
                  {groupPath: "Continent", showLabels: true, headerTemplate: 'Template' }
                ],
                leafItemSettings: { showLabels: true , textOverFlow: "wrap"},
            });
        });
    </script>

    <script  id="headertemplate" type="application/jsrender">
        <div style="background-color: white; margin:5px">
            <label style="color:black;font-size:medium;" ></label><br />
        </div>
    </script>
Palette Color Mapping
Treemap is having support for palette color mapping. You can set the color for palette color mapping using the property color in palette color mapping.
//To set the colors of the paletteColorMapping during initialization
  var treeMapSample = new ej.datavisualization.TreeMap($("#treeMap"), {paletteColorMapping{colors: ["red","green","blue", "yellow"]}});