Getting Started
3 Nov 20165 minutes to read
This section helps to get started of the HeatMap component for TypeScript.
Initialize HeatMap
The HeatMap can be created from a HTML ‘div’ element. To create the HeatMap, you should call the ‘ejHeatMap’ jQuery plug-in function.
<!DOCTYPE html>
<html>
     <body>
        <script type="text/javascript" src="heatmap/heatmap.js">
        </script>
     <div id="heatmap"></div>
     </body>
</html>
Prepare and Populate data
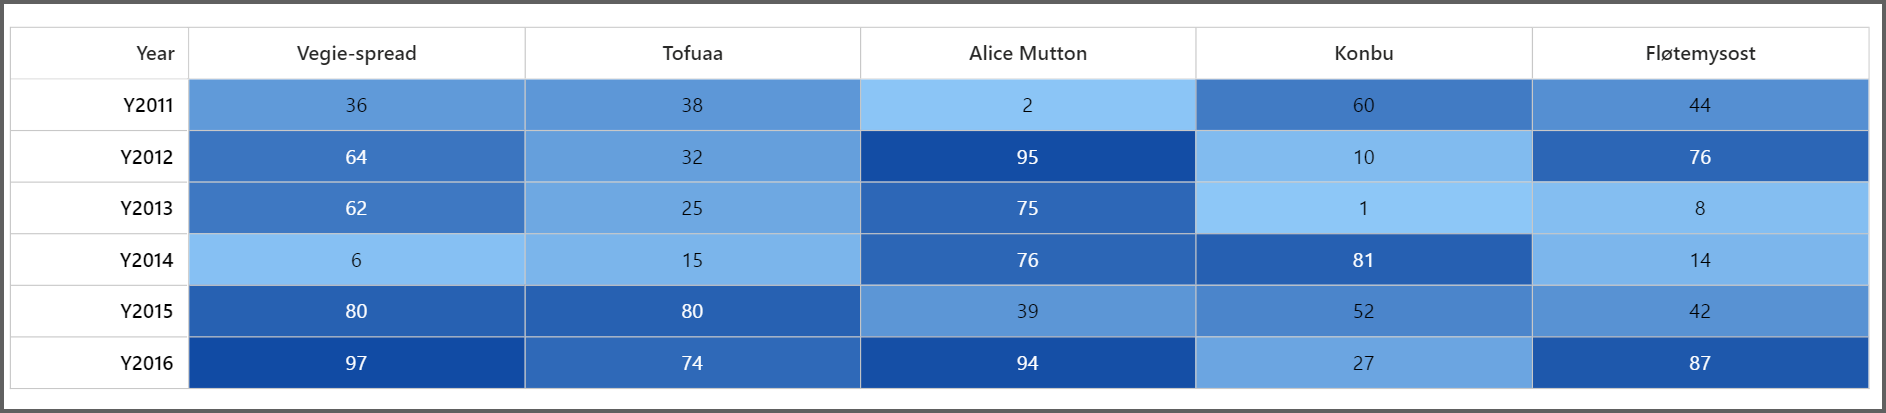
Populate product information in a collection called ItemsSource.
Map data into HeatMap
Now data is ready, next we need to configure data source and map rows and columns to visualize. For that, need to prepare ItemsMapping add it in resource and set items source and mapping.
Next we can configure color range for these values using color mapping and also configure items mapping based on items source.
$(function () {
    var heatmap = new ej.datavisualization.HeatMap($("#heatmap"), {
        colorMappingCollection: [
            { value: 0, color: "#8ec8f8", label: { text: "0" } },
            { value: 100, color: "#0d47a1", label: { text: "100" } }
        ],
        isResponsive: true,
        itemsSource: itemSource,
        width: "100%",
        itemsMapping: {
            column: { propertyName: "ProductName", displayName: "Product Name" },
            row: { propertyName: "Year", displayName: "Year" },
            value: { propertyName: "Value" },
            columnMapping: [
                { "propertyName": columns[0], "displayName": columns[0] },
                { "propertyName": columns[1], "displayName": columns[1] },
                { "propertyName": columns[2], "displayName": columns[2] },
                { "propertyName": columns[3], "displayName": columns[3] },
                { "propertyName": columns[4], "displayName": columns[4] },
                { "propertyName": columns[5], "displayName": columns[5] }
            ],
            headerMapping: { propertyName: "Year", displayName: "Year", columnStyle: { width: 105, textAlign: "right" } },
        },
    });
});
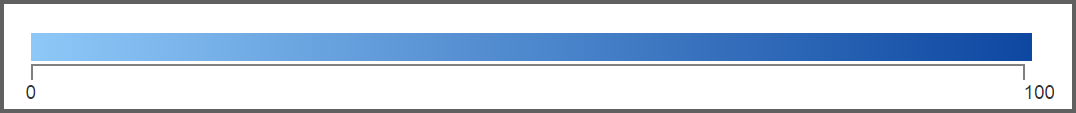
Initialize Legend
A legend control is used to represent range value in a gradient, create a legend with the same color mapping as shown below.
<!DOCTYPE html>
<html>
     <body>
        <script type="text/javascript" src="heatmap/heatmap.js">
        </script>
            <div id="heatmap_legend"></div>
     </body>
</html>$(function () {
var heatmaplegend = new ej.datavisualization.HeatMapLegend($("#heatmap_legend"), {
colorMappingCollection: [
{ value: 0, color: "#8ec8f8", label: { text: "0" } },
{ value: 100, color: "#0d47a1", label: { text: "100" } }
],
height: "50px",
width: "75%",
isResponsive: true
});
});