How can I help you?
Getting Started
This section explains how to create a simple Pivot Table report with the Report Designer by using the Shared Datasource and save it into the Report Server.
Start Report Designer
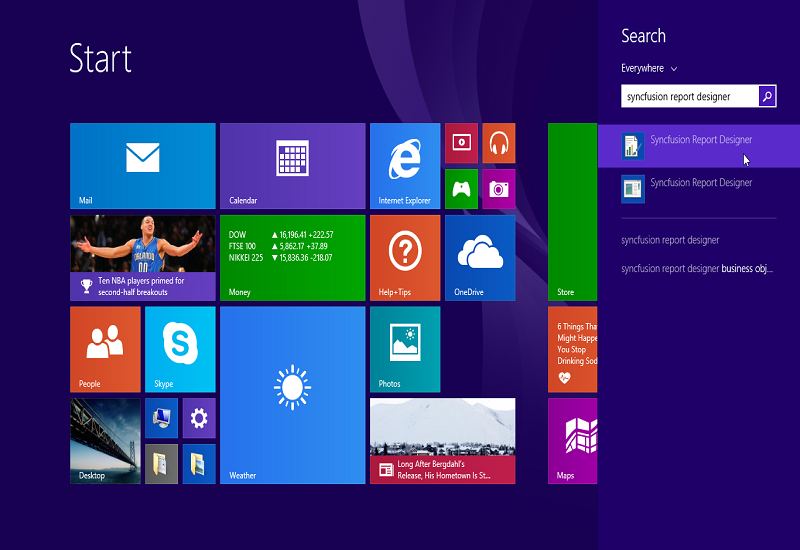
You can start the Report Designer from installed location (C:\Program Files (x86)\Syncfusion\Report Designer\ReportDesigner\ReportDesignerUtility.exe) or you can search it from Start by name of Syncfusion Report Designer.
Shared DataSource
Shared datasource are used with the RDL reports for future management. When the connection information changes due to server enhancement, then you can change the connection in the Shared DataSource by using the Report Server roles instead of opening and editing the connection information in all the reports.
Add DataSource
This section explain you the steps to create Shared DataSource for report.
-
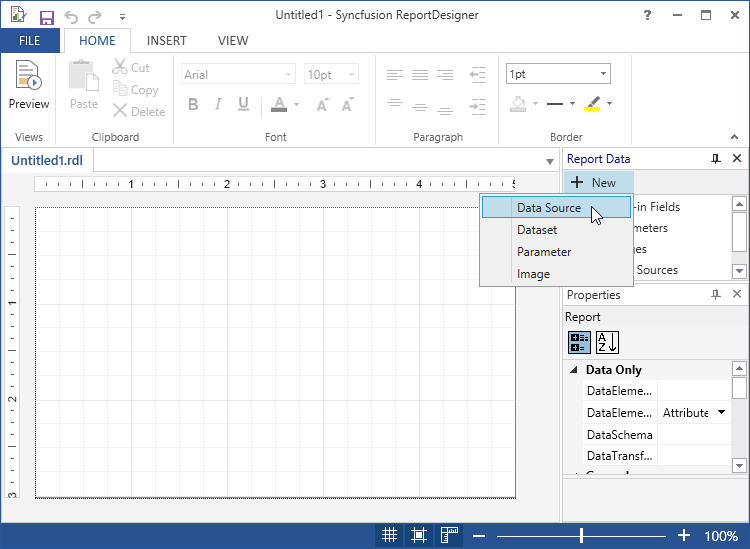
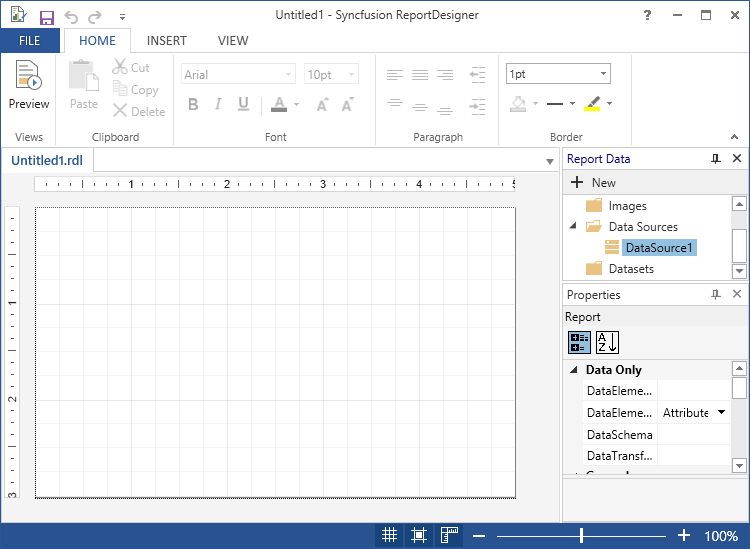
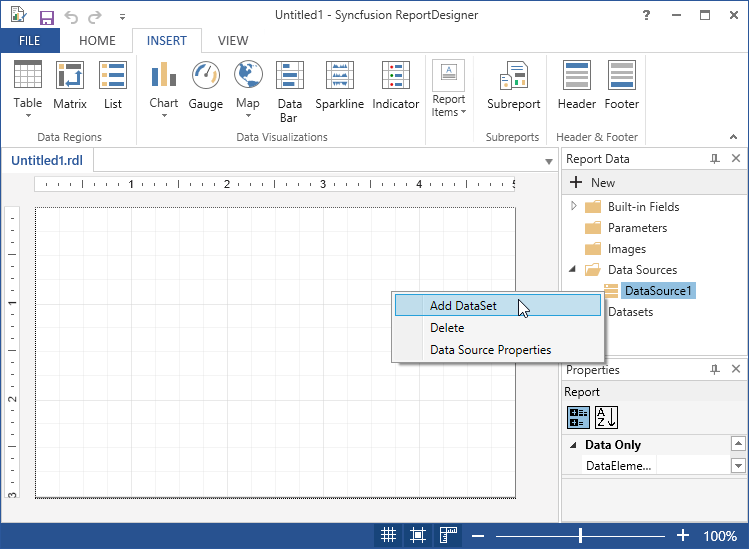
Create new DataSource for report from Report Data Window.
-
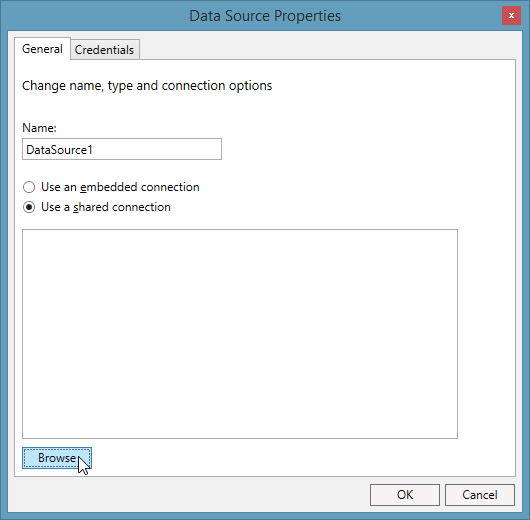
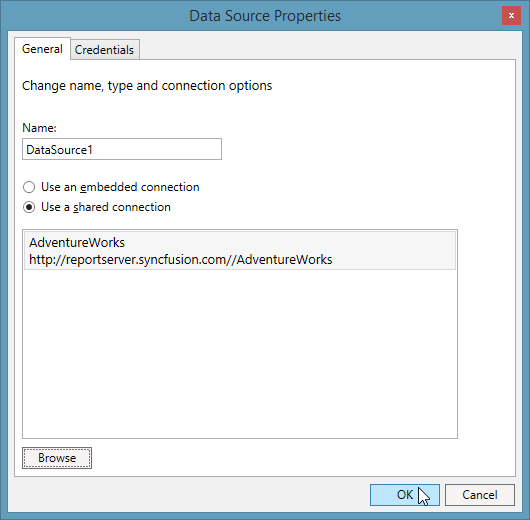
Choose Shared Connection in DataSource Properties Wizard and click browse option to link the Shared DataSource from Report Server.
-
Enter your Report Server URL
http://reportserver.syncfusion.comand select open to show the available data source from Report Server and select the DataSource by clicking Open.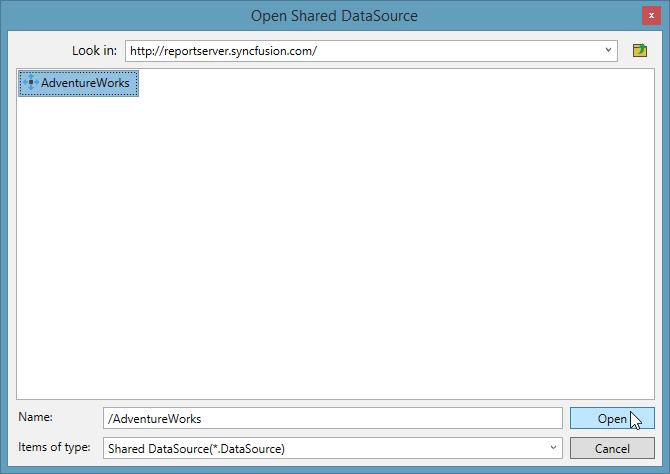
-
Now, you can update name and click OK to add the selected Shared DataSource with report.
Add a Dataset
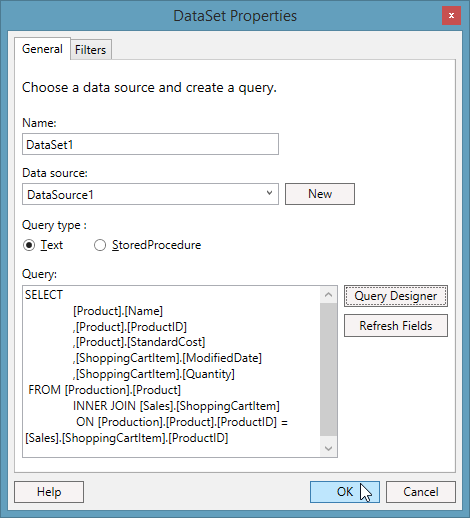
RDL Dataset will have collection of fields and query information to retrieve the data from DataSource. This section explains you the steps to create dataset for report.
-
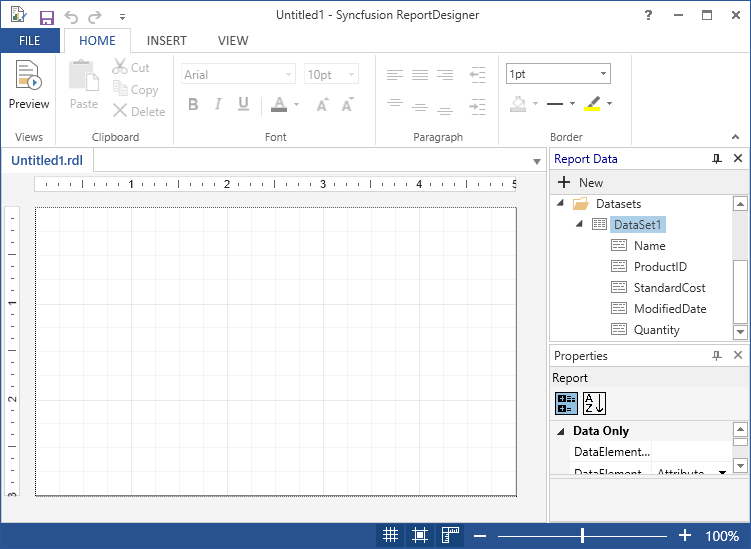
Create new Dataset for report from Report Data.
-
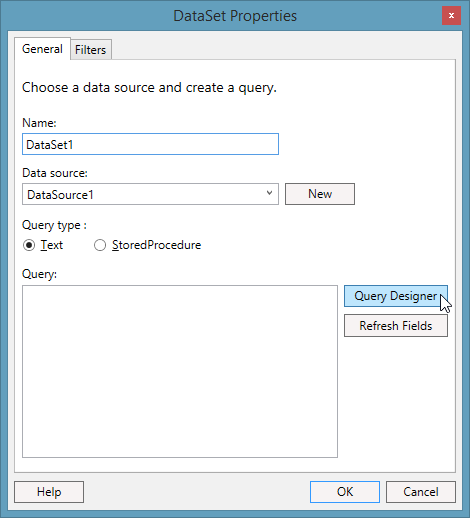
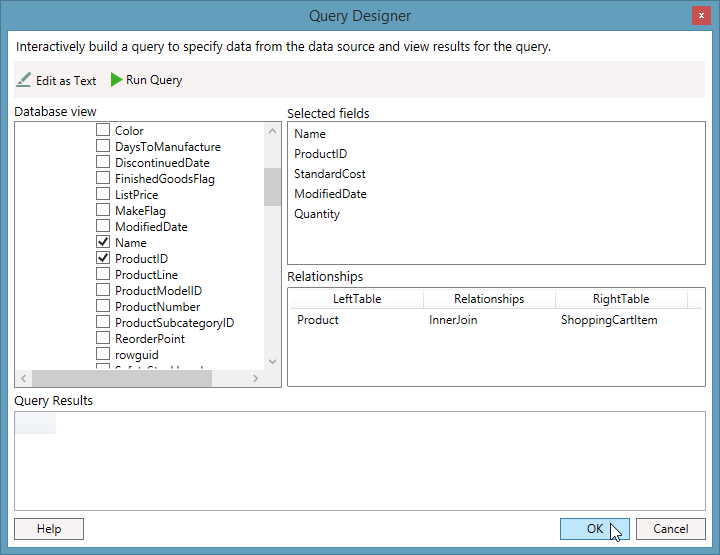
You can enter the query directly in the Query Textbox or you can use the Query Designer to interactively build the query and view the result of the query. Here, the dataset is created with the help of the Query Designer.
NOTE
In the Query Designer, you can explore the database table, view and interactively build the select query by selecting limited columns in the tables.
-
Click OK to add the created Dataset with report.
Create Pivot Table
-
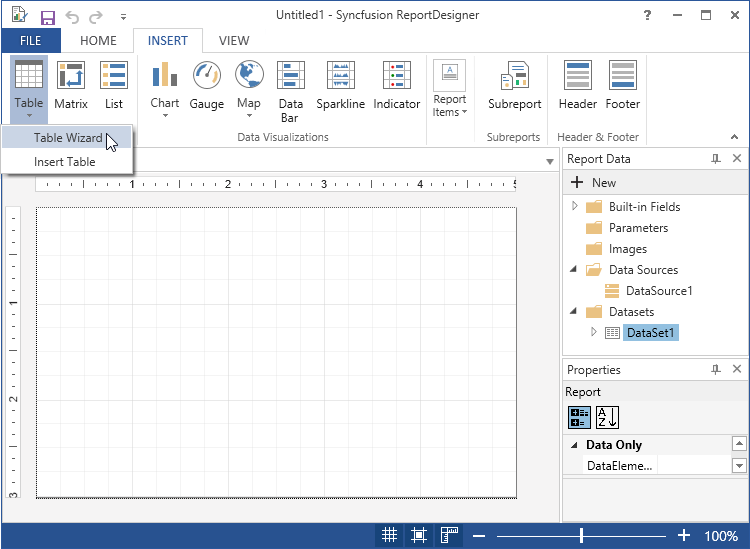
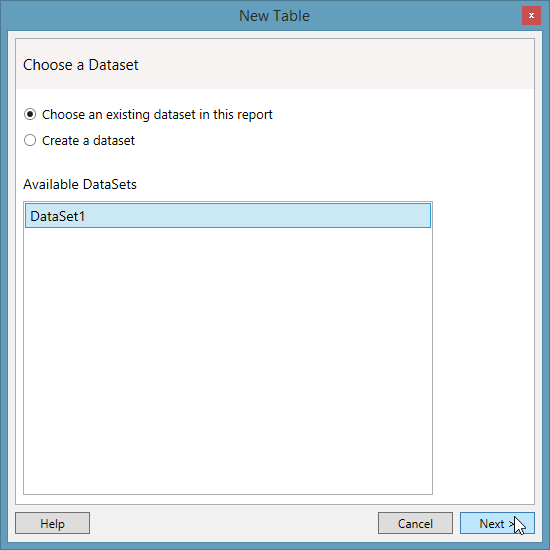
Click Table option from Insert Tab and select Table Wizard.
-
Select the Dataset from Available Datasets and click on Next to create Pivot Table using selected dataset fields.
-
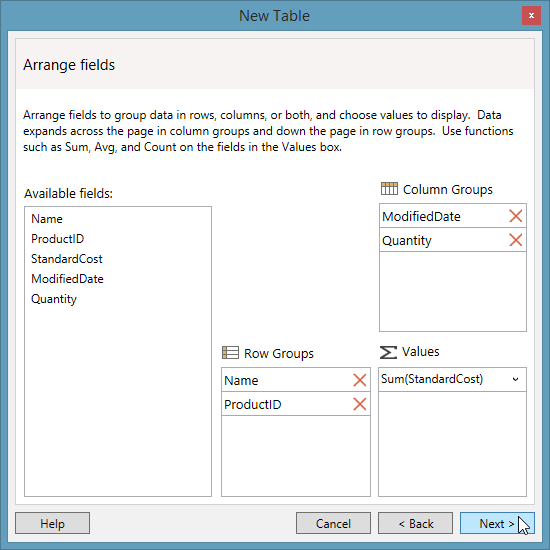
Drag and Drop the fields into respective category.
-
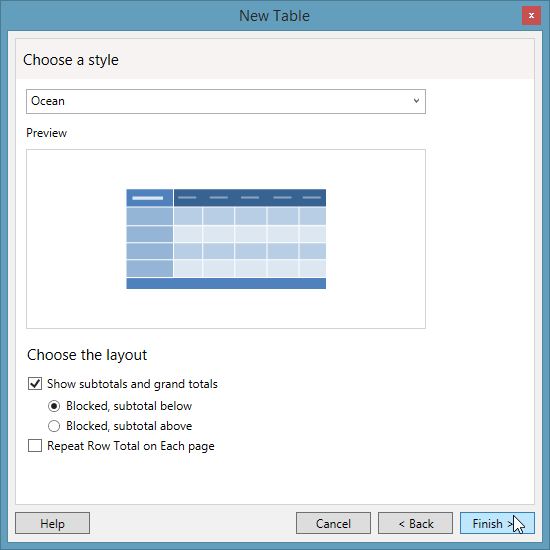
Report Designer has five built-in themes to create a Table. Select the theme and choose the layout from available options then click on Finish to create pivot Table from selected Fields.
-
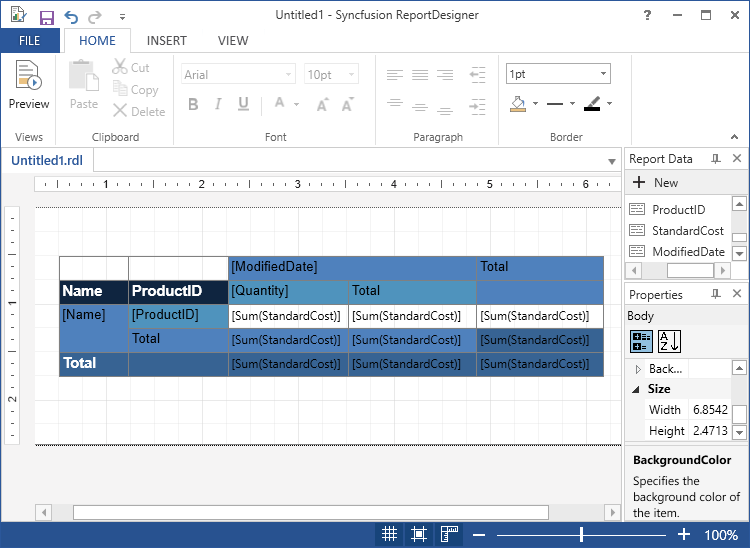
Now, you can change the appearance of the Table and cells by selecting respective item in report section and can be changed with the help of Properties Window.
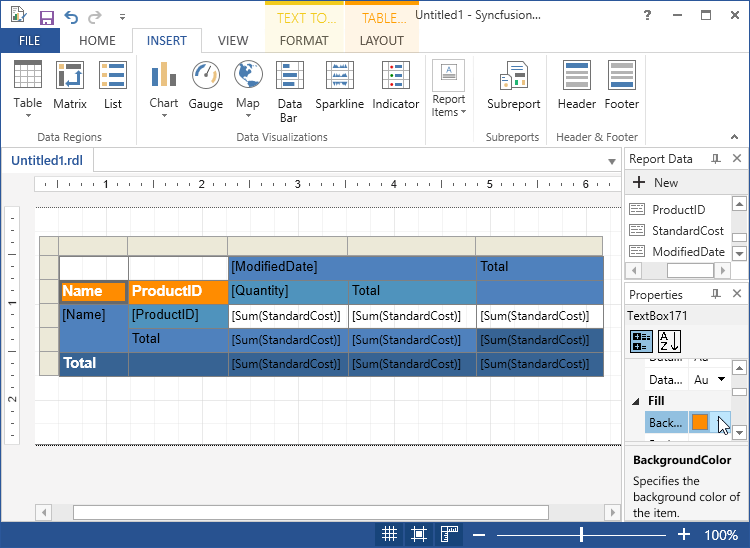
-
You have to select the cells to format as like below screen shot. Also, here “C” used to format cell with currency format.
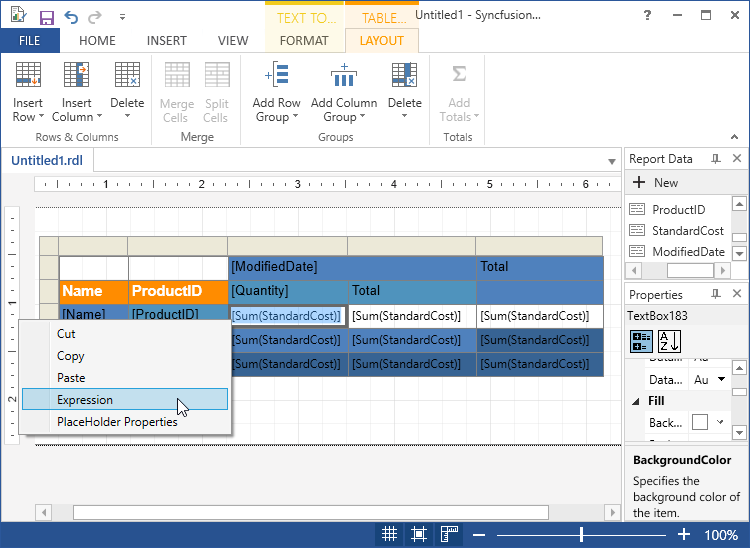
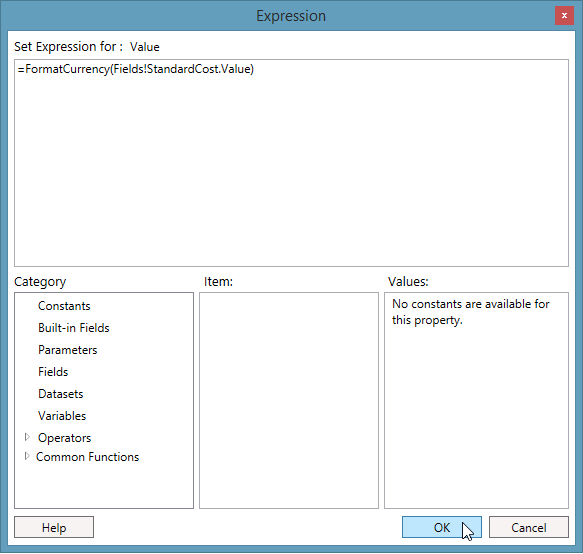
-
Click Preview from Home Tab to preview the created report with Report Designer.
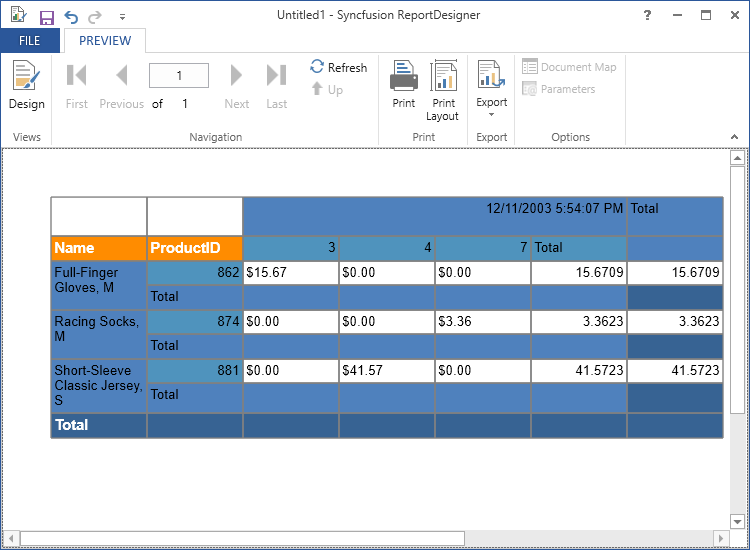
NOTE
Refer to the Report Designer documentation from the following link to create a report using various elements and also to use various features of the Syncfusion Report Designer.
Saving Report
-
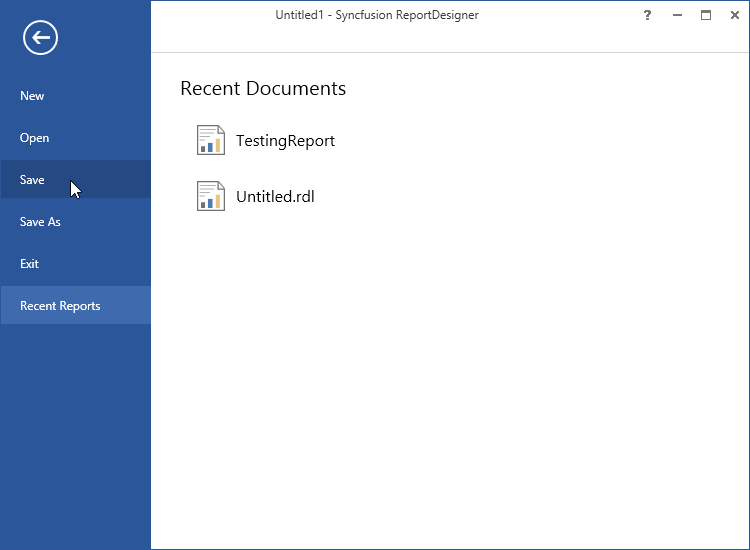
From the File menu, Click on Save to open the Save dialog.
-
Enter your Report Server URL
http://reportserver.syncfusion.comand select open to show Report Server with Report Server credential.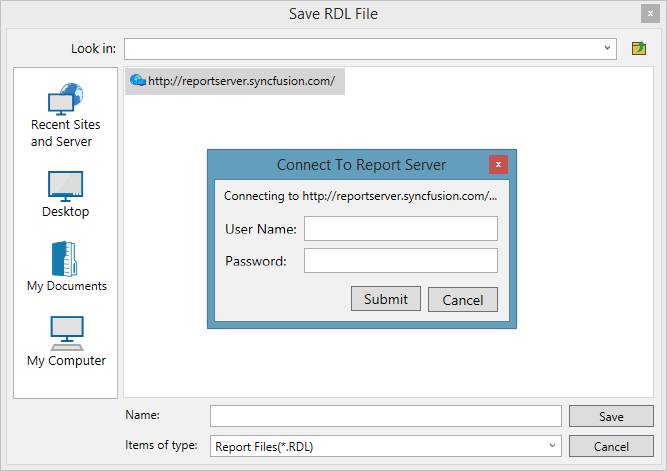
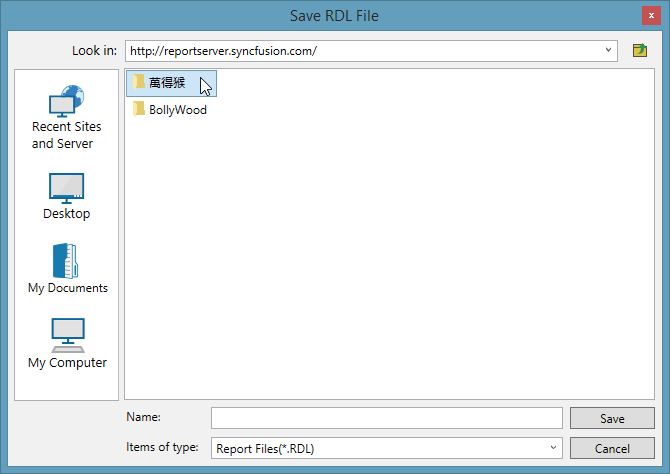
NOTE
Category will be shown with Folder icon.
-
Select the category and provide a name to save the report in respective category.
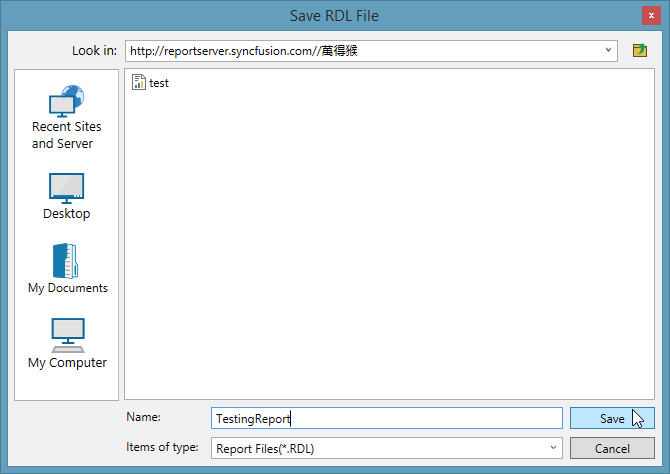
NOTE
We must select a category to save the report.