Data
The report data returns the result of an external datasource query value. The report data contains the datasource name, query, fields and parameter details in the report.
Add data
This section explains, how to create a new Data.
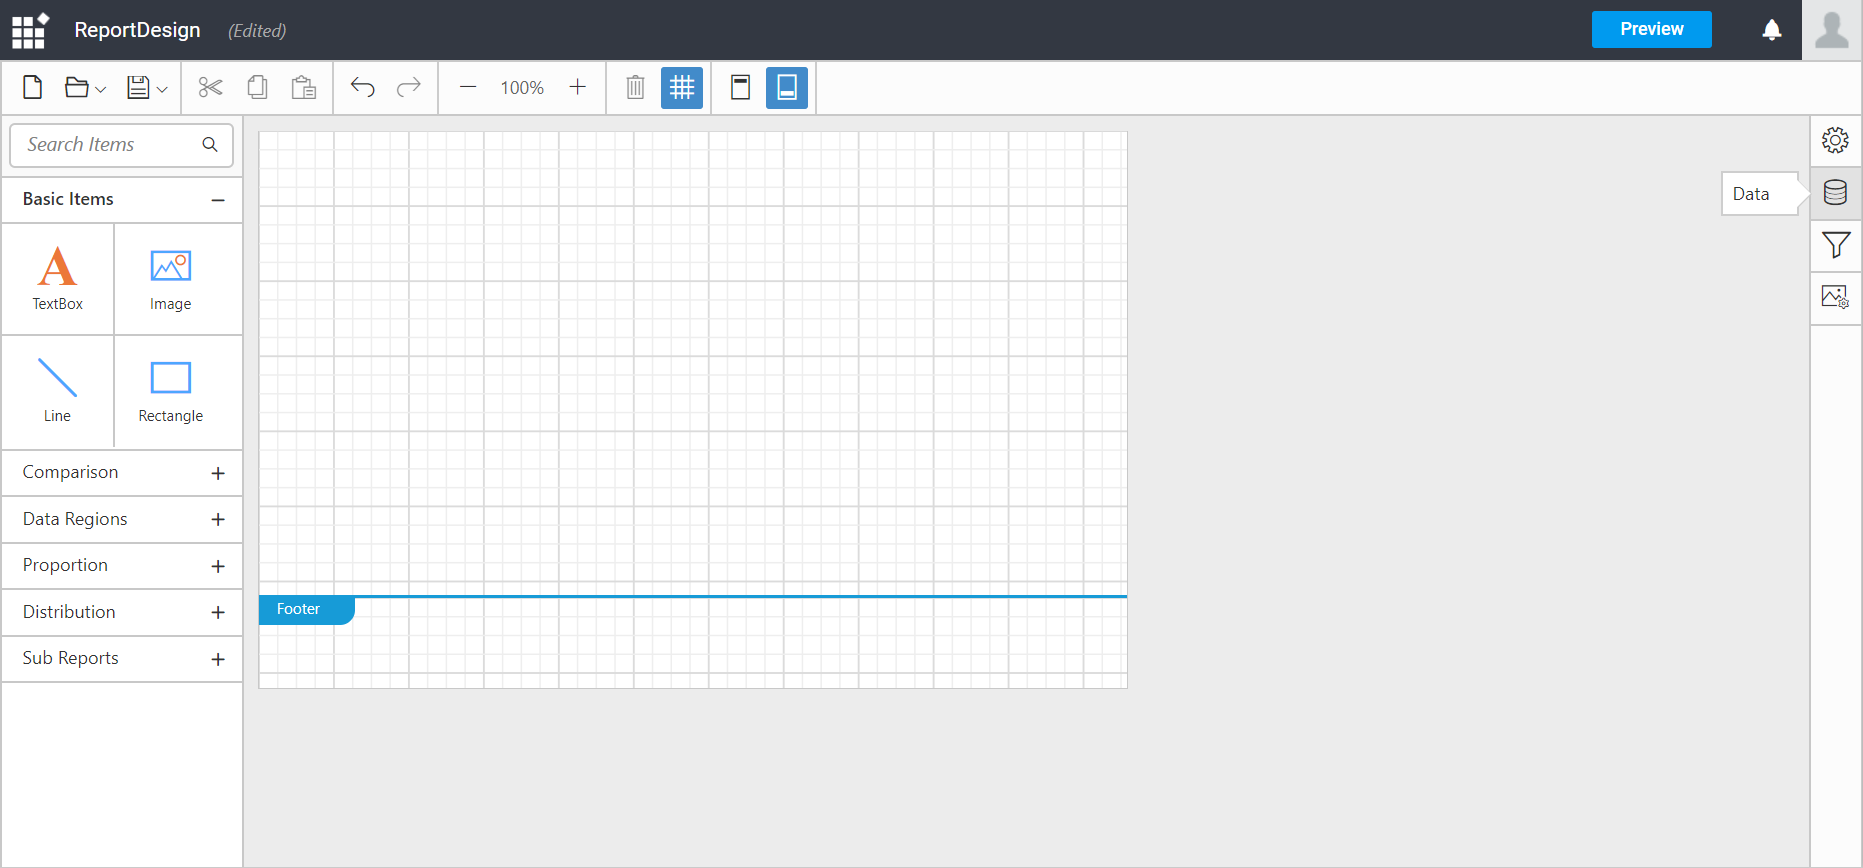
Click the Data icon in the configuration panel to launch a Data configuration.
Click the Add DataSet button in Data panel.
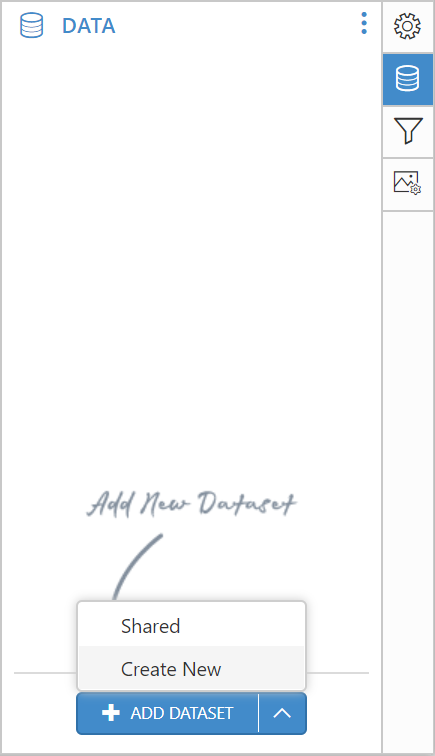
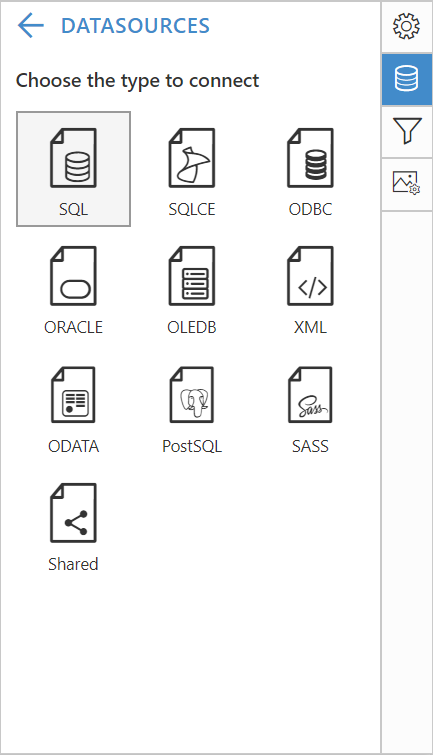
Click Create New in the context menu, In the connection type panel, click the data source type that you want to connect. Here, SQL connection type is used to demonstrate.
In the new data source configuration panel, fill the server name and related details.
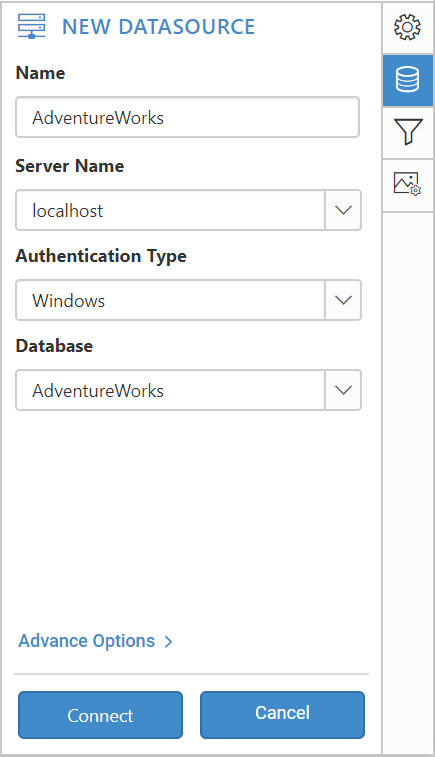
Click the Connect button, then the following view will be displayed.
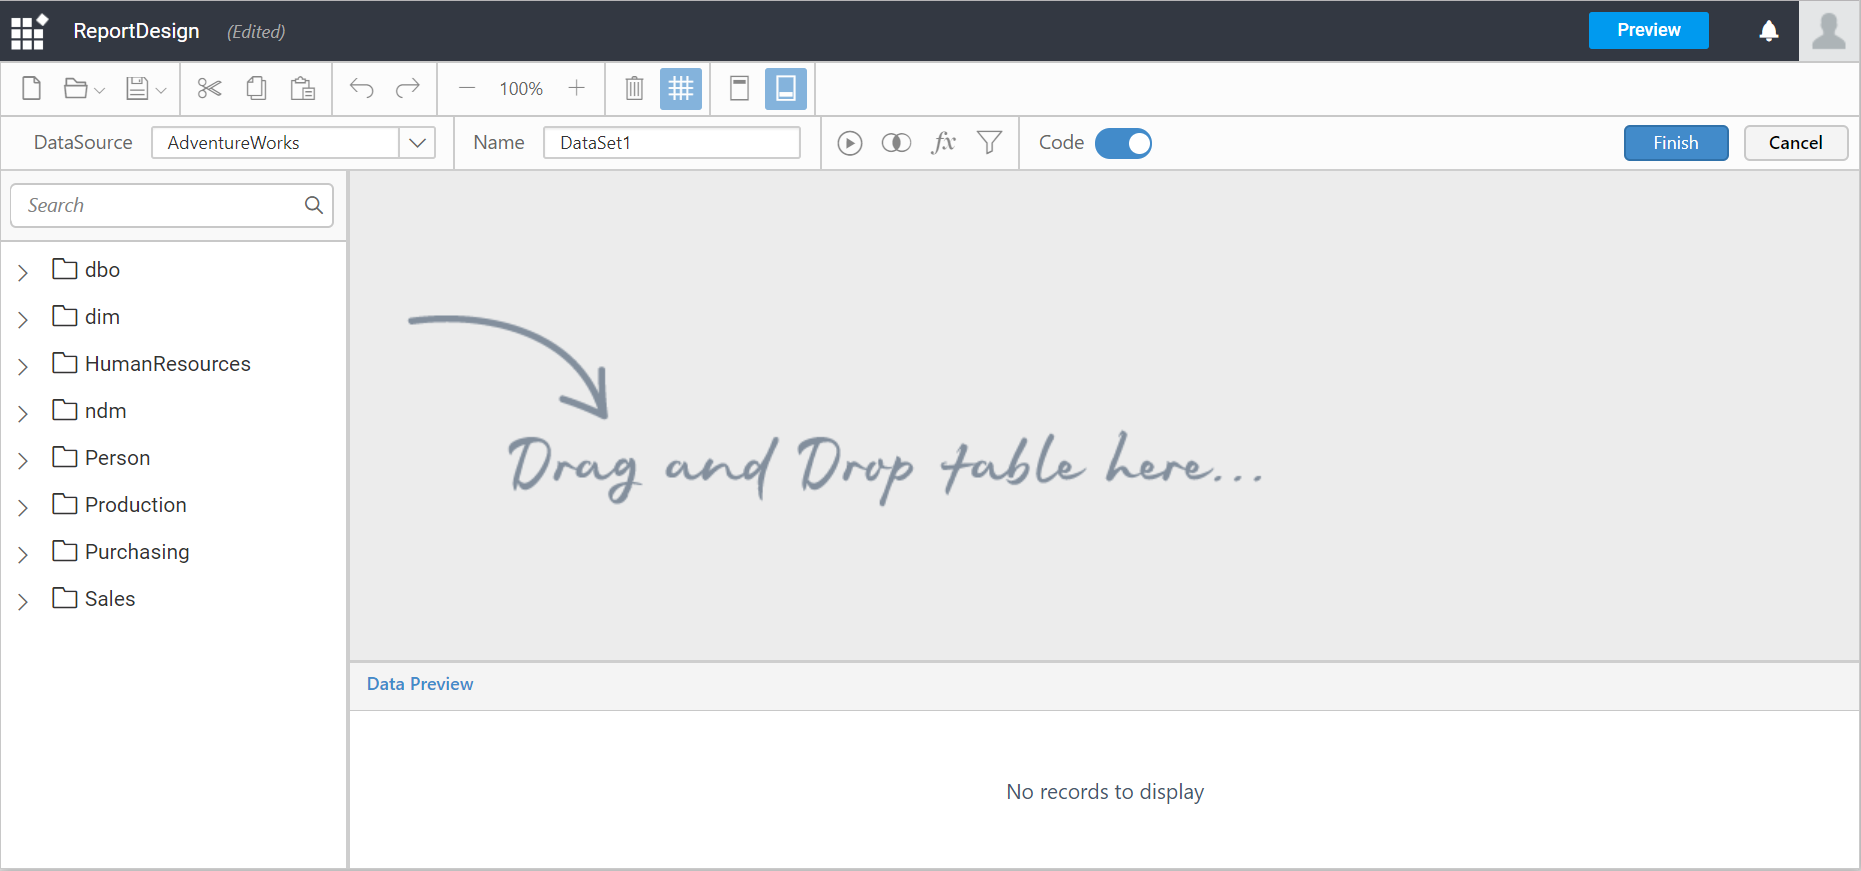
You can set the dataset name of your choice by editing the Name field in the query designer toolbar pane.

To search the table or view from the data collection, you can use the Search field in the left pane of the query designer.
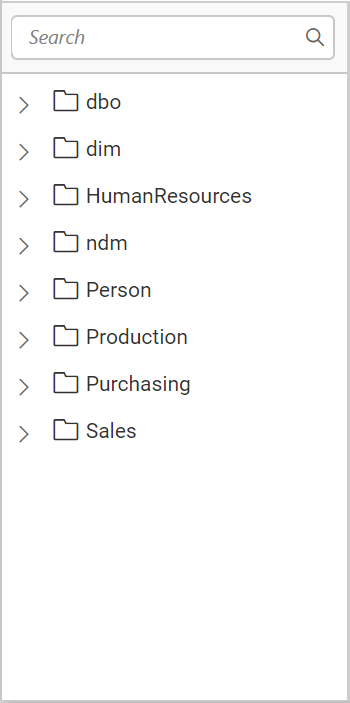
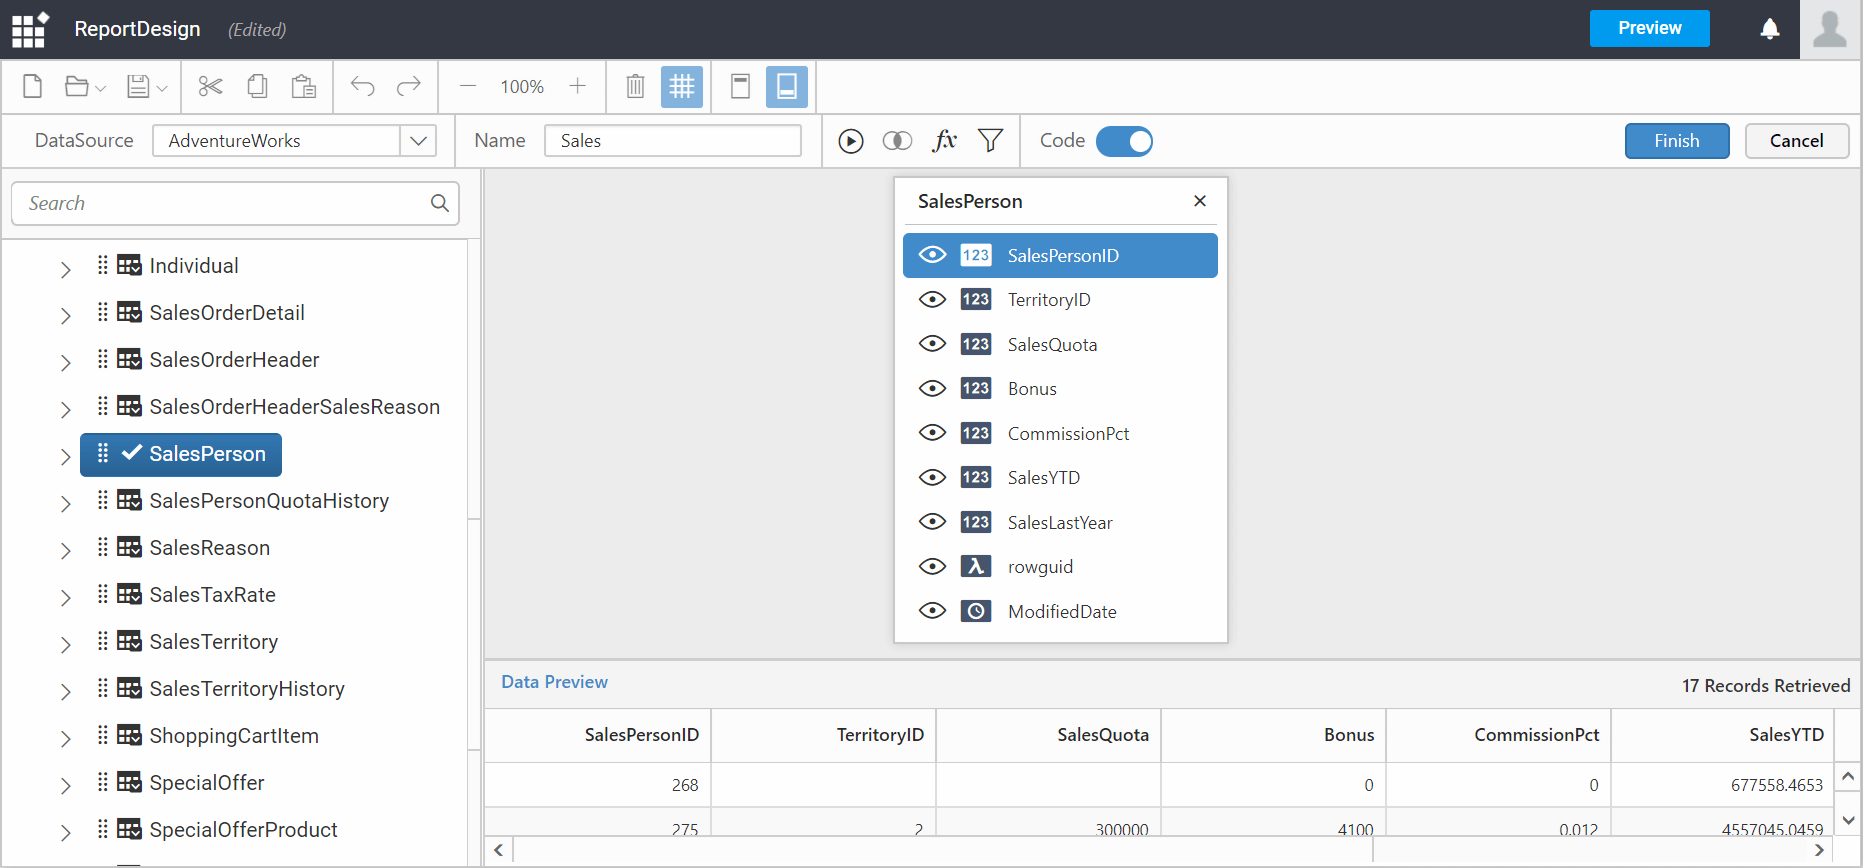
The left pane holds the tables and views associated with the connected database.
Drag the preferred table or view from the left pane and drop into the center pane labeled with Drag and Drop tables here like below.
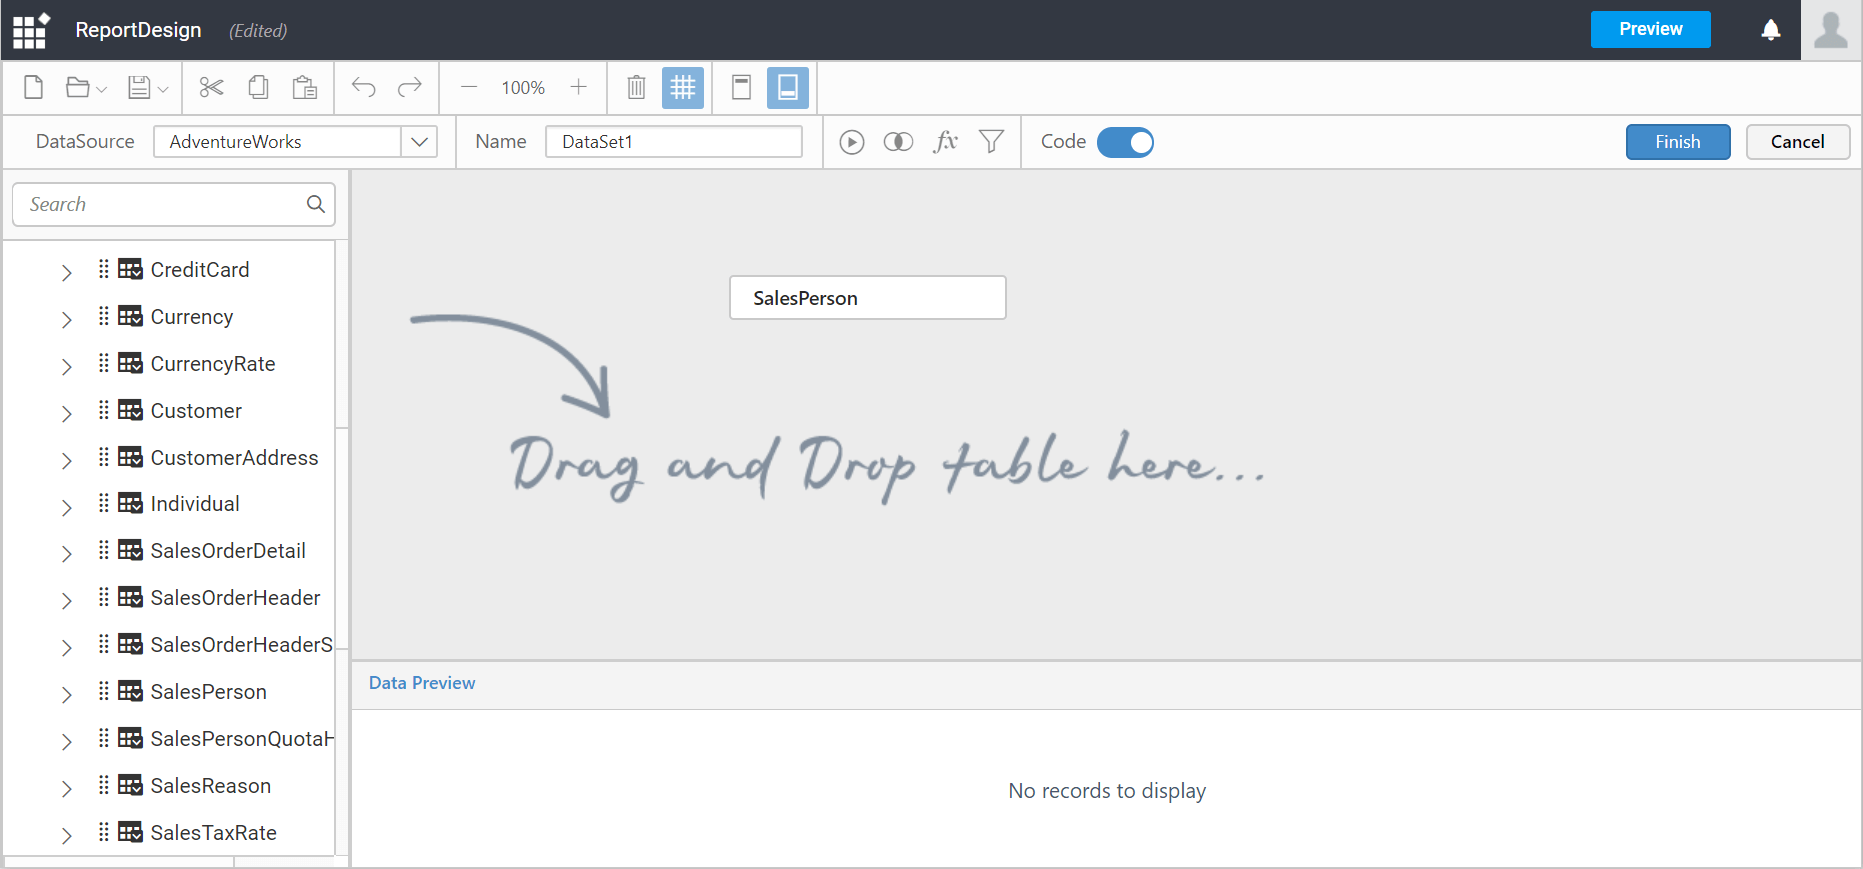
After you drop the item into the center pane, it displays like below:
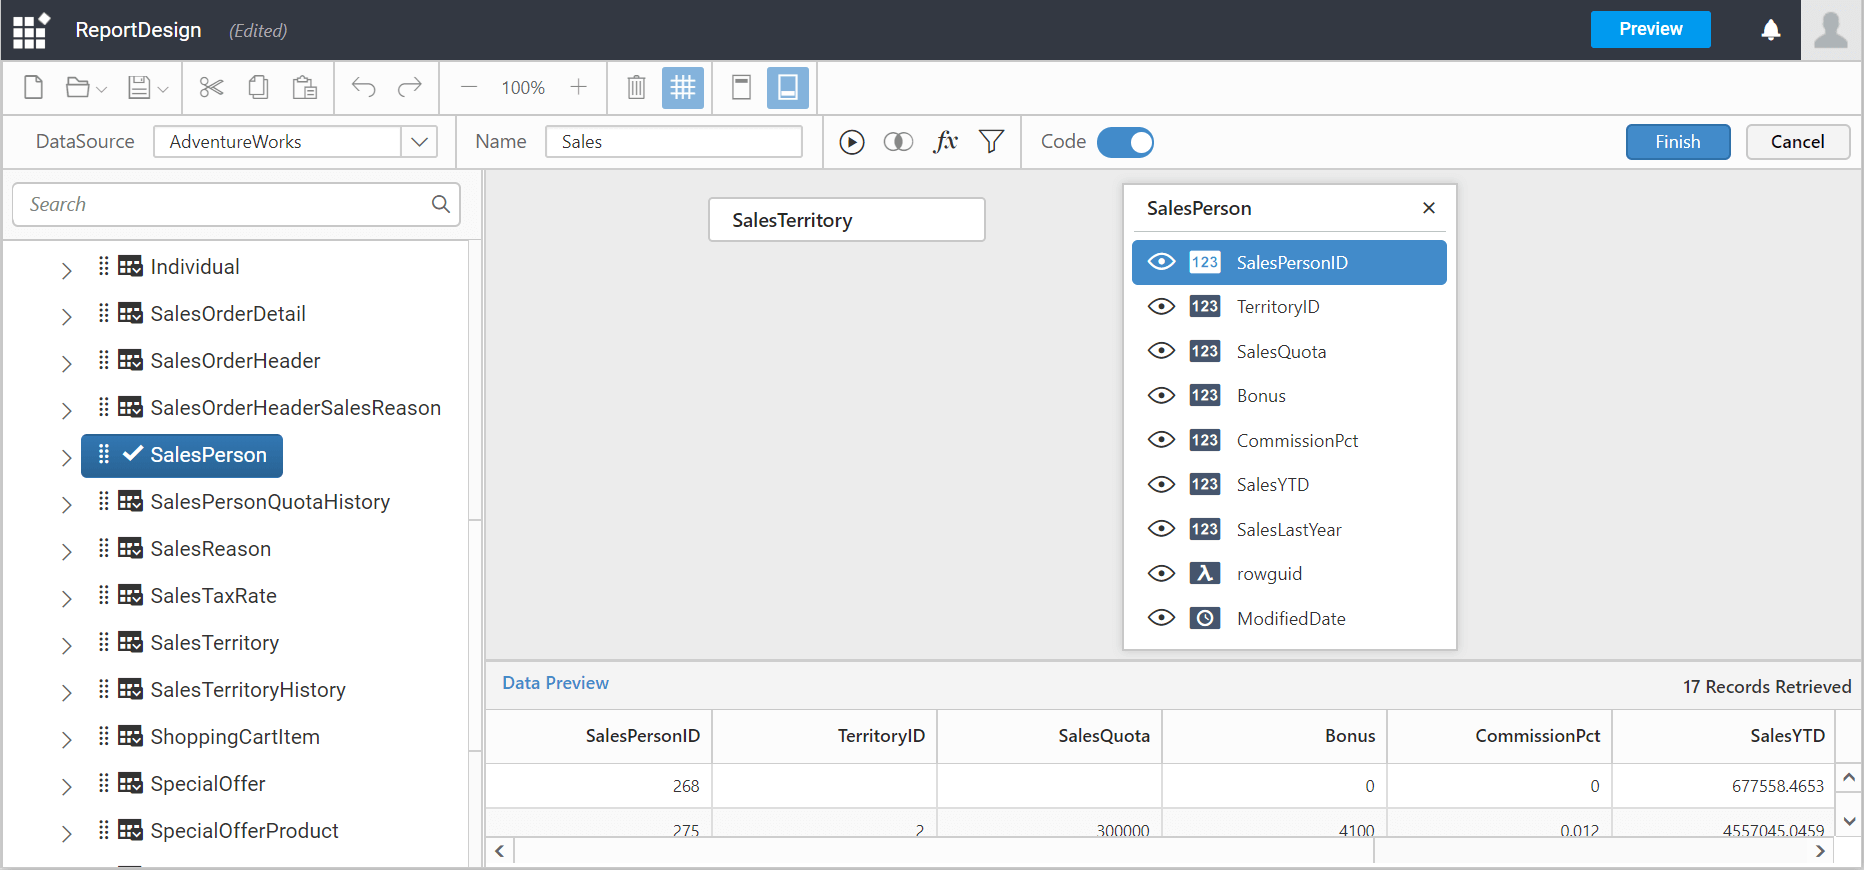
Visualize multiple table data
You can visualize multiple tables by drag and drop another table into the design pane.
Now, the QueryJoiner dialog will be launched. You can relate the columns as desired. Refer Joining Tables.
Click the Finish button in the tools pane (highlighted below) to add the data with the report.
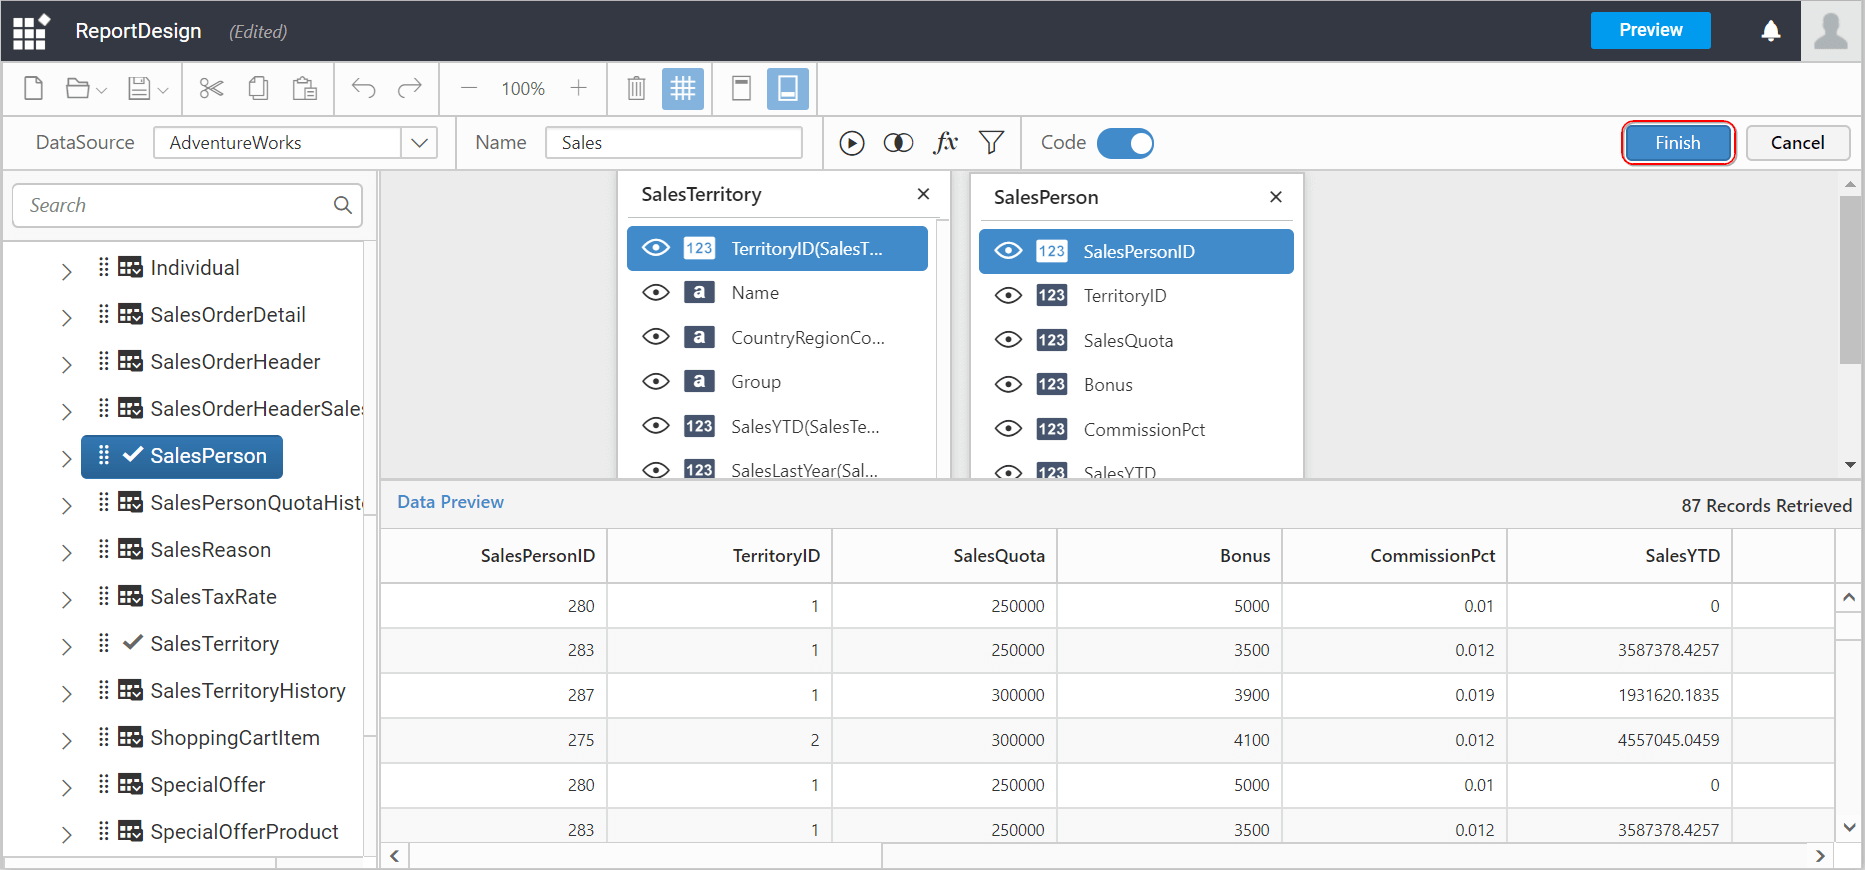
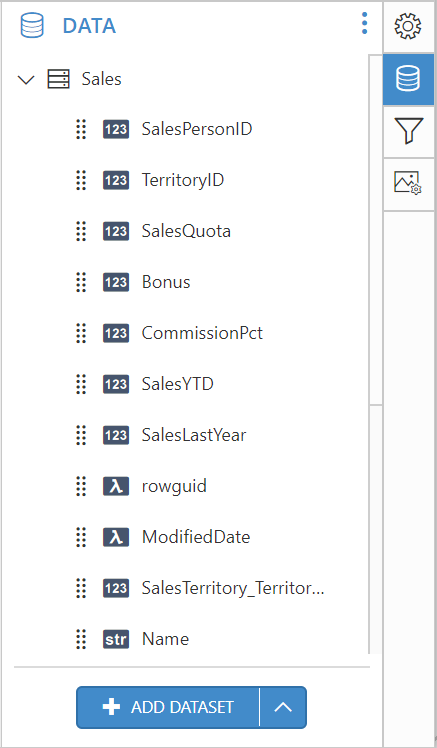
Now, you have successfully created a Data with the Web Designer Report. The table fields will be listed in Data panel like below.