How can I help you?
Sunburst Elements
The Sunburst region represents the entire chart and all its elements. It includes all the chart elements like Legend, DataLabel, Levels etc. The major properties of the Sunburst Chart are as follows
-
datasource– Provides the data that are used to generate the chart. -
valueMemberPath- Property based on the which the data segments are rendered in the Sunburst chart -
legend– displays the legend of the Sunburst Chart -
levels- displays the hierarchical levels for the chart -
datalabel– displays the datalabel for the Sunburst Chart
Start and End Angle
Start and End Angle
You can change the start and end angle of Sunburst chart using startAngle and endAngle property as shown in below code
"use strict";

//Set startAngle and endAngle to draw the sunburst chart

ReactDOM.render(
    <EJ.SunburstChart id = "sunburst1"
    startAngle = {-90}
    endAngle = {90}
    >
    </EJ.SunburstChart>,
          document.getElementById('sunburst')
);
Sunburst Radius
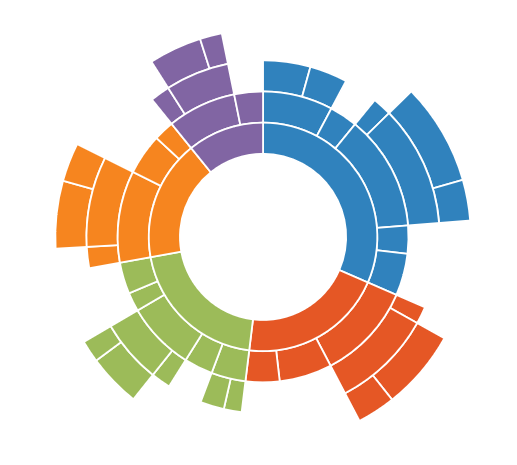
The Radius of the Sunburst chart can be customized by using the radius property. The default value of radius is 1 and its value ranges between 0 and 1
"use strict";

//Set radius to the sunburst chart

ReactDOM.render(
    <EJ.SunburstChart id = "sunburst1"
    radius = {0.8}>
    </EJ.SunburstChart>,
          document.getElementById('sunburst')
);
;
;
## Sunburst Inner Radius
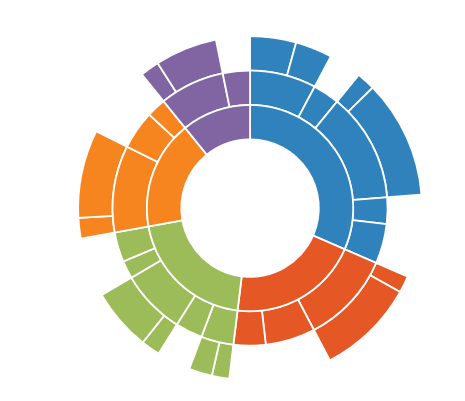
The Inner Radius of the Sunburst chart can be customized by using the innerRadius property. The default value of innerRadius is 0.4 and its value ranges between 0 and 1
"use strict";

//Set inner radius to the sunburst chart

ReactDOM.render(
    <EJ.SunburstChart id = "sunburst1"
    innerRadius = {0.5}
    >
    </EJ.SunburstChart>,
          document.getElementById('sunburst')

);
;
;